Showing posts with label VIX. Show all posts

2023-08-01

Bear Rally Over? Yield Curve and VIX Turn Higher

It has been a long and winding road in this bear market. Yes, I still believe a bear markert is underway until new highs are made. I haven't been tactically bearish on the market over the preceding months, onyl taking some small swings when setups looked good. Until those old highs are taken out, my bear market call from November 2021 remains intact.

First, the classic bubble chart pattern hasn't been violated:

A double-top is a valid expression of the "return to normal" phase. Bullish sentiment and speculative behavior return to near peak levels, propelling the major indexes or stocks into double-tops. Anecdotal, but cryptocurrency speculators believe a new bull market is underway. Bitcoin BTC has a pattern that is consistent with the classic top though:
Tesla, Google, Amazon and Meta all sport the classic pattern with no hint of an imminent double-top. The paradox stocks are Apple and Microsoft. Both have achieved new all-time highs. Their massive weight in the S&P 500 technology sector (nearing 50 percent at times) propelled that sector to a new all-time high in July. If I'm correct in my assessment, this will turn into an overthrow of a double-top pattern and not an extension of the bull market.
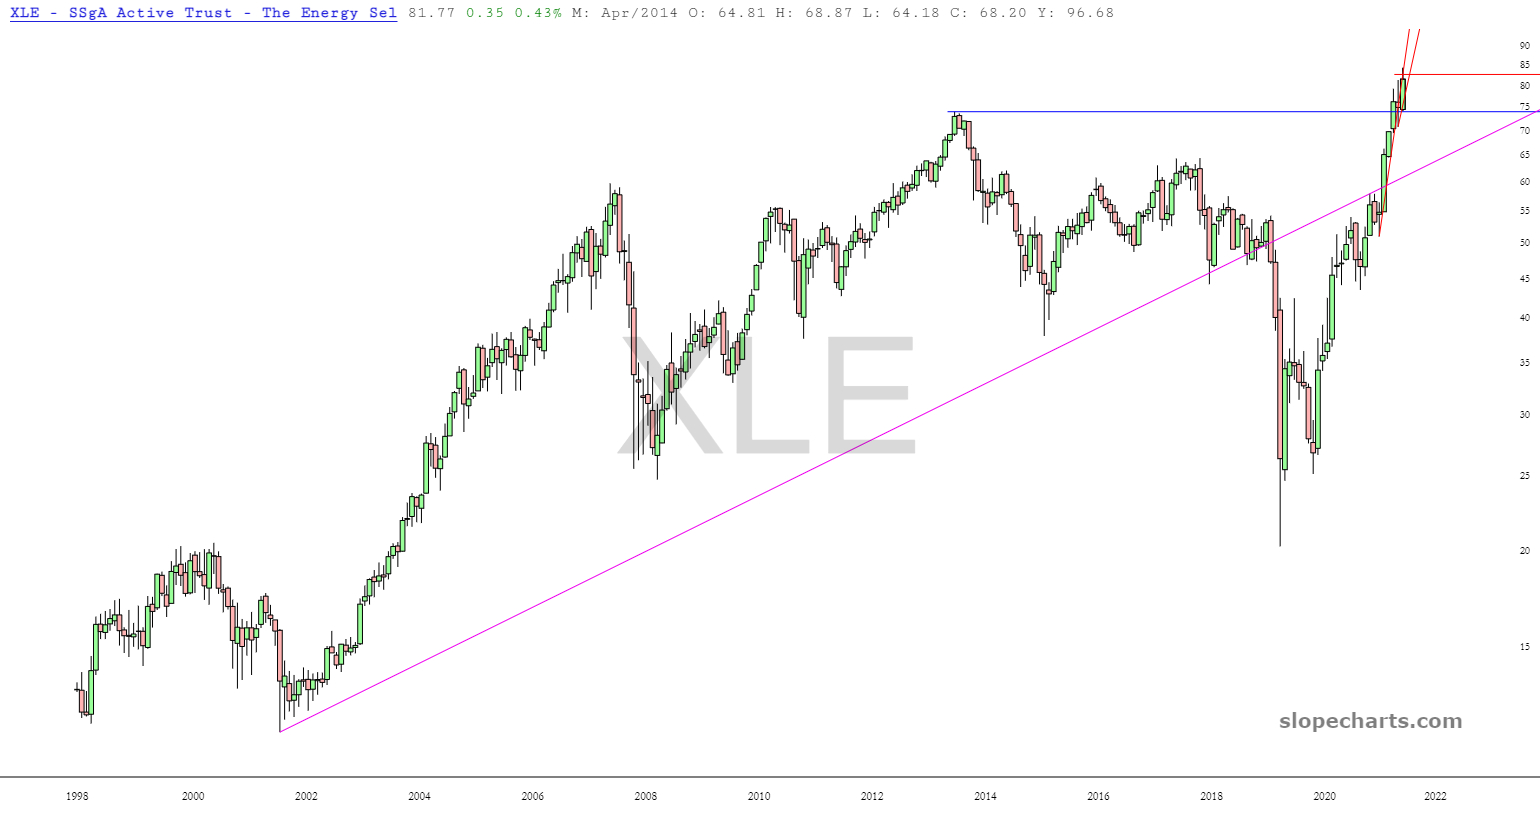
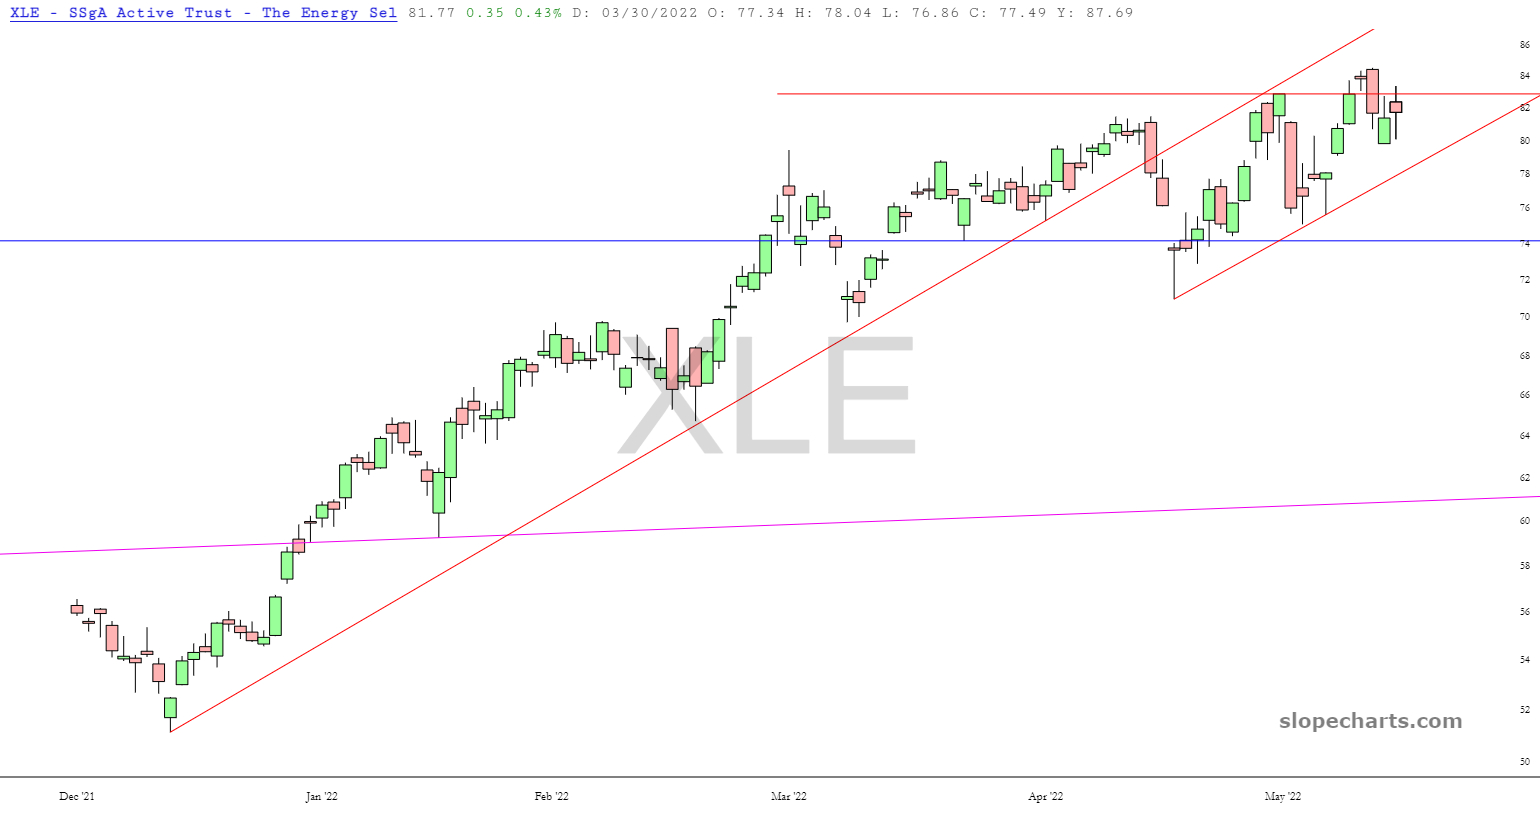
Industrials also achieved new all-time highs this year. Energy and materials made new highs in the second-quarter of 2022 and remain within striking distance of new highs.
I'll digress here and give the bullish argument over the longer-term. Assume for a moment the U.S. was primed for a recession around the time the coronavirus hit. The government then wrecked the economy and then flooded it with far too much stimulus. Even though there's no official recession in 2023, the U.S. government is running deficits on par with the fallout from 2008:
There's nothing bullish about that chart long-term. Growing deficits will increase inflationary pressure. Falling deficits could trigger deflationary pressure. Since stocks are priced for perfection, deviation out of the Goldilocks Zone will trigger price declines in all sectors at least for a time, barring an explosive move higher in energy as we saw in early 2022.

I don't want to belabor the valuation topic, but here is the price-to-earnings ratio divided by the growth rate (PEG) and the spread between investment grade corporate bonds and the Federal funds rate.

Going back the to the bull thesis: what if the government front-loaded stimulus and the bear market/recession doesn't materialize? In that case, either an extension of the bull unfolds or the transition occurs without the bear move. Both EFA and EEM, the developed and emerging market ETFs, bottomed in October 2022, with EEM having a little overthrow this year:
To wrap up the bull case: the government flooded the economy with stimulus, triggering a temporary inflation surge. Inflation settles back into the Goldilocks Zone, as does GDP growth, sub-2 percent for both. In the short-term bull scenario, stocks enjoy an extension with tech and other speculative assets resuming leadership. In the longer-term scenario, the transition to new leadership such as industrials, energy, commodities and foreign markets takes place without a major bear.

Back to the bear scenario, one of the strongest signals for a recession has been the inverted yield curve. It doesn't indicate an imminent recession, rather it signals the pre-recesesionary stage. The actual recession comes when the yield curve steepens. Going back the past four decades, this has always occurred when the Federal Reserve slashed rates. Right now, the yield curve is steepening because long-term bond yields are rising faster than short-term yields. It is a small move at the moment, but the spread has made a higher low, indicating the final low might be in.

The 10-year treasury yield has a bullish formation that may or may not complete. If it completes, then higher long-term rates will sink financial asset valuation and could indicate a stagflationary recession. The 30-year mortgage would be on its way towards 10 percent, a level that would almost assuredly kill home prices too. On the flip side, a traditional steepening via Fed rate cuts would be another bear market and recession like we've seen in 2000 and 2008.
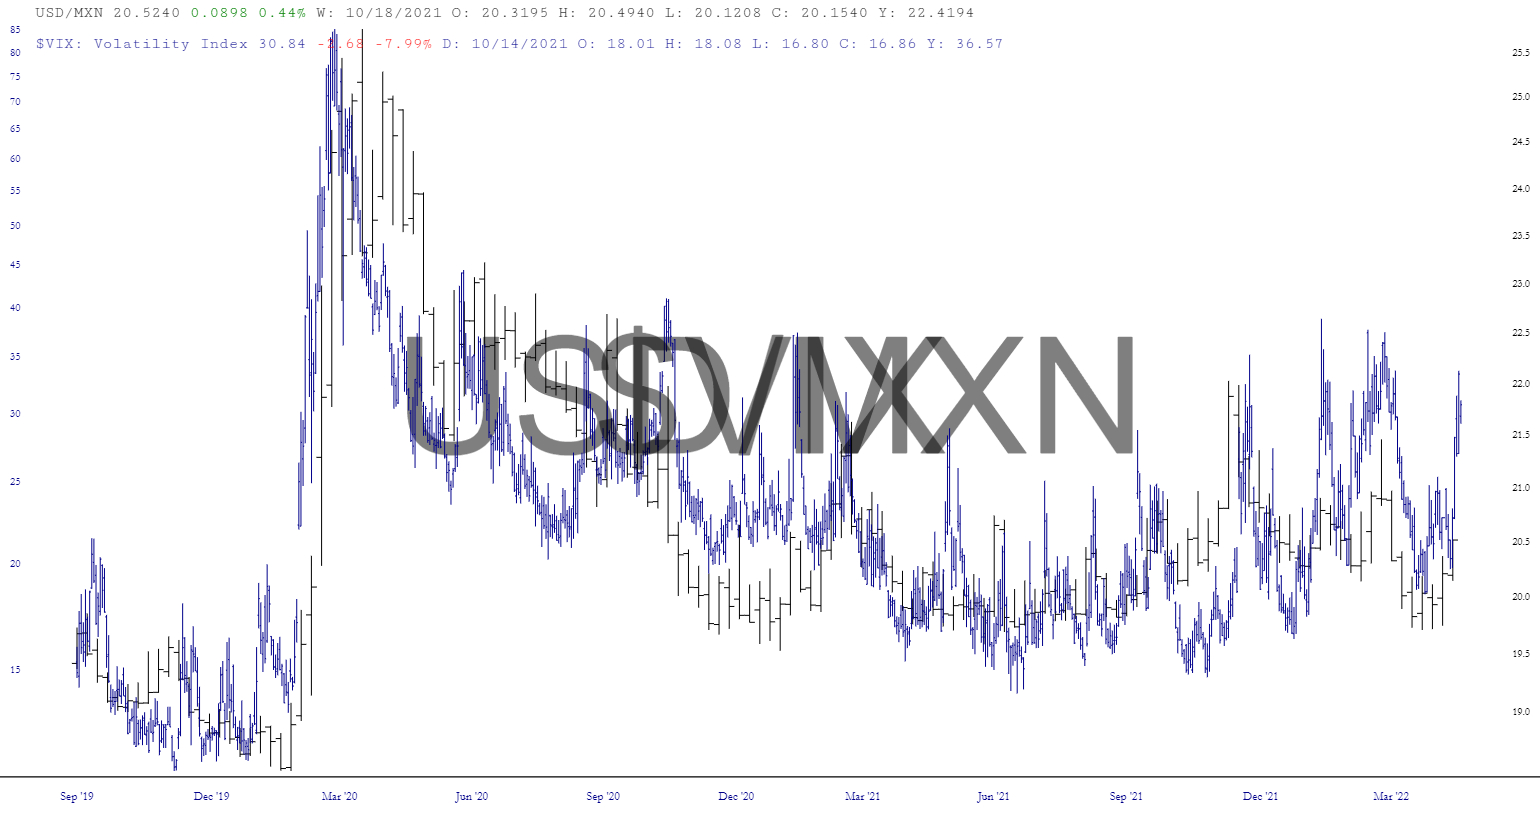
The decline in the VIX has been a hallmark of this bull market. The VIX has fallen below the level reached at the November 2021 peak, indicating fear is gone. Here's the VIX overlaid with the 2s10s spread:
VIX isn't a great indicator in that it tends to be coincident with the 2s10s, but a rising VIX indicates rising fear, likely because there's bearish action in parts of the market ahead of the full-blown bear. Here's a look at when the VIX bottomed ahed of prior bearish periods:
There will be bearish trades emerging very soon if the yield curve has finished inverting and moved into steepening. Ditto if the VIX follows it higher. With September and October coming up, the calendar supports a market top scenario here. New highs on the major indexes will invalidate the bear scenario, as will a falling VIX. If the 2s10s inverts further or moves sideways, it will indicate no imminent economic pressure. If the 10-year yield fails a breakout for instance, the yield curve might invert further while the broader stock market interprets the falling yield as disinflationary and therefore bullish.

2023-03-09

Nice Wicks on the Peso

I am focused like a laser on USDMXN because it is very correlated with the VIX Index over the longer term and it looks a hell of a lot like February 2020 with a break below pattern (the green line in 2020) before an explosion higher. There are also possible double-wicks off support if today's move holds.

2022-11-07

VIX Crushed

The RSI falls to a two-decade low. Meaning? Maybe nothing except VIX isn't going to rip as people expect because this is a rolling bear market. VIX rips in bull market corrections and panics.

2022-10-10

VIX Termination or Rally Spot

I plugged VIX onto my long-term volume profile + stochastic chart and saw something interesting. VIX is at a point that marked and end of its advance in the prior two bear markets. It only went higher during the two years of the Asian Crisis that culminated with the Russian debt default and collapse of LTCM. Higher in this context doesn't mean a spike dead ahead. Although it might spike, this is a long-term indicator. Instead, it's saying to me that VIX will remain elevated and probably peak sometime in 2023.

2022-08-12

VIX Back to Earth

VIX should touch the April low before the rally concludes. Apple is about 1.5 percent away from filling the gap. My expectation is the 50-percent fibonacci will hold today, easily done as long as the indexes don't have a shocking reversal. Volume is all but dead today so a reversal in unlikely. Even though bear market rallies have pierced the 50-percent retracement level before, expect to see the claim that they "never have" spread like wildfire this weekend. That'll set up the final short-covering and retail rush into longs, which should conclude next week. There's less than 4 percent upside max upside left for the indexes. Some assets like ARKK are below their highs. Whether or not they rip to new highs along with the market or continue diverging will help inform how large and how long the final push will be.

2022-07-29

Indexes: Breakout or Pullback

I dropped a green line on RTY. I'm not sure I want it there, but I put it there for comparison purposes. Nasdaq reversed at that line, and that's the one I place the most weight on. The Nasdaq is still the more important index because it is leading the rally.

A breakout above that line is the more important event because it will cause more short covering. A pullback is a normal test, and I'll be looking to buy the dip.

Having said that, now is the time to start hunting for new short targets. I will be looking top down, from macro trades in FX, bonds and commodities down to sectors and then individual targets. VIX will hopefully return to April levels, providing cheap puts.

2022-07-15

A Bearish Chart Reverses

The Mexican peso breaking down was one of the most bearish charts I'd seen because it is highly correlated with VIX. Inversely with the peso, positively with the USDMXN cross. 

Since this has become a failed breakout, this is now a strongly bullish signal for the overall stock market and a sign that VIX may decline in the coming weeks. It is volatile enough that it could traverse the entirety of the pattern over the next month. A decline to the red support line would require a 3.6 percent decline in USDMXN, a decline of 5 percent takes it to longer-term green support. 

The two don't move one-to-one. MXN had been overshooting VIX lately for example. The best time for correlated charts with weak short-term signals (palladium and Nasdaq being one of the worst with a time lag as long as a year) are when one of them generates a strong signal on its own. Peso broke down the past couple of days and now reversed. VIX didn't confirm the breakdown in the peso. Now the breakdown has reversed. As far as this relationship goes, that's a fairly strong bullish signal for stocks here, and a bearish one for USDMXN and VIX.

2022-06-12

Mexican Peso and VIX

Mexican peso gapped lower on the open along with stocks. Mexican peso has been highly correlated with VIX in recent years.

2022-06-02

The Bear Market Hasn't Even Begun

Or why sentiment is still extremely bullish.

Yahoo: Investor fears set the table for an 'echo bubble' down the road

"I think sentiment is starting to set up as a contrarian movement with [the latest University of Michigan survey data] added to it," Sonders said, referencing her earlier tweet noting consumer expectations for stock prices are at a six-year low.

"I think [on] the behavioral side — what investors are actually doing — we're not quite there yet," Sonders adds.

Separately, a growing chorus of Wall Street analysts and traders are the sounding alarm bells on a final bear market capitulation. By implication, this means all rallies are suspect until the air clears. That may take time, as the Fed isn't likely to blink for at least a couple meetings.

On the flip side, not everyone is bearish and holding out for a final washout. Yves Lamoureux, president of Lamoureux & Co., maintains his longer-term bullish thesis for stocks into 2025.

"To me the price bottom is in. I do not expect another low in indices. The new bull market begins in earnest amid the chaos and massive panic as usual," he wrote to Yahoo Finance in a note.

Lamoureux sticks by his thesis that the 40-year trend lower in interest rates is not over — and that there will be a new deflationary scare. This will force the Fed to pivot as the economy slows, with lower rates inciting a new tech bubble trade. Or so goes the theory.

"If correct, we will see a dramatic shift of fear to FOMO, especially in tech stocks," Lamoureux writes. "They're long duration assets and they'll rally hard once market participants see rates trending lower. The tech rally will be an 'echo bubble' of the previous recent one."

Perhaps not a market for the herd to fear, after all.

Lamoureux's framework is logical. He's saying this is another correction within the 2009-??? bull market and that the conditions that produced the deep corrections of 2011, 2015, 2018 and 20202 are still operating. None of those were bear markets though, and neither is this correction if the low is in.

I think this time is different is because there has been no spike in the VIX despite five months of stock price declines. All the corrections since 2009 were sharp and swift. This one is more slow and plodding despite a few shocks. 

I also see investor complacency everywhere. I cannot say with 100 percent certainty that a bear market is underway because I do not know the future, but I can say with 100 percent certainty that the behavior of investors is 100 percent primed for a bear market. There has been no major rush for the exits. Most investors are sitting put and thinking this is another dip in the mold Lamoureux discusses. Maybe they get right one more time, who knows? 

Conditions have changed though: inflation is much higher than in any prior correction. There is no VIX capitulation spike, the put/call ratio remains elevated but with no spike, sentiment is increasingly bearish, but still extremely bullish on a long-term time frame.

I do think the inflation panic is overdone right here, but if I'm wrong about that, higher inflation will crater the market in the months ahead. The bigger risk is what I think is the more plausible bear scenario: inflation stays relatively high. Everyone looking for a Fed pause, pivot or return to 2009-2021 policy is assuming consumer inflation goes all the way back to 2 percent CPI. To get there will take a major deflationary event that sinks stocks. Without that, and without the CPI sliding much lower, inflation will settle higher than anticipated. Wage inflation will start breaking out as more workers demand double-digit pay increases to cover the multi-year rise in prices.

Bulls need inflation to collapse. They need inflation to collapse for a good reason, not a bad reason like a financial market panic, because stocks go down in that scenario. I don't see stocks going on to new highs or even going much higher at all with the S&P 500 Index already at 4120 as I'm typing. 

2022-05-22

Just Sell Already!

I felt a bit like Happy Gilmore asking the ball why it didn't go home on Friday, but in this case it's the major indexes not finding their home at a lower, buyable level.
I didn't feel angry though. I did give back a lot of profit on Friday because I didn't get out early enough, when I could sense the market wasn't behaving like it should in a meltdown. I made money on the day though, much more counting the entire week of trading. More importantly, I know the big trade is still in front of me.

What I feel even now is something more like resignation. Up until now, I've mostly enjoyed the decline and bulls getting their comeuppance. Friday was the moment I realized they might never sell. It's like watching a man walk on the train track. You feel a little worried when the train is far off. You expect he's going to jump off the track. Then you're yelling and screaming, maybe he's deaf? But then he looks at you and smiles. Friday was the moment when I realized many bulls won't ever get off the tracks.

Let's look at VIX from the 2000s bear market because I think that's our best template from the VIX data. The bear markets of 1973-1974 and even maybe 1929 are the more relevant setups for the geopolitical and macroeconomic backdrop, but there was no VIX then...

VIX peaks in the bull market! The 1998 high was the peak of the VIX and not even the 9/11 terror attacks could top it. There are some smaller peaks at capitulation points: the first sell-off wave in March 2000 ends in April, the bear market low in July 2002, the slightly higher low in March 2003 before the bull market really takes off.

Now here's the past 15 years:

The financial crisis produced a major VIX event because it was a financial crisis. It's a tautology, but when the crisis is the financial markets themselves, then extreme readings are going to be common. The coronaslam came close, but didn't beat 2008. All the other spikes came at the end of QE, a little after with yuan depreciation, and then Volmageddon and the 2018 correction during QT1. VIX is elevated again now with QT2 starting next month.

Takeaway: VIX can remain elevated during the bear market, but it's the bull markets that produce massive VIX spikes. A market needs to be caught off-guard for a VIX spike. All the sentiment and data showing bearishness is why VIX will stay suppressed during the bear market. It will be elevated and there will be capitulation points, but another massive spike will require an event or an escalation such as sovereign debt failures. We may well get them, I'd bet on it myself, but they aren't necessary.

So Much for Sentiment  

I don't find general sentiment too useful, haven't for many months. I am expecting a VIX spike and bull capitulation in some form, but I don't know when it arrives. Beyond that, I think it is more important to look at subject-matter sentiment. What trade is overdone? Inflation.

Supply chain problems do not equal inflation. Persistently high energy prices are not inflation in and of themselves. If there is a supply shock it can produce inflation if it is printed over. That's what happened in the 1970s and March 2020: the government and central bank panicked. They didn't let the economy suffer a recession. Result: high inflation. The mistake in the 1970s was they chickened out over and over until the early 1980s, then let a back-to-back brutal recession wring inflation out of the system.

Everyone thinks they know what the Fed will do now, and all assets are priced assuming a Fed policy turn is coming. Even down here at 3900 on the S&P 500, that is priced for a policy reversal. Bulls are still all in. Even many bears think the Fed will capitulate because of a recession.

I do think the Fed will capitulate, but the difference is I expect an extremely brutal conclusion first. They aren't going to act until they're reasonably certain inflation is done. Bulls who think a drop in interest rate is bullish are correct long-term, but very wrong for the short or intermediate-term.

I won't say energy is the place to short yet, but it is becoming a place to short. The volume profile shows support is about one-third below the current price of XLE.


2022-05-14

The Two Paths Ahead

There are two paths ahead over the next four to eight weeks. One is energy down, bonds up, stocks up. A bear market rally. The other is all hell breaks loose. Crude breaks out, treasury bonds break down and stocks collapse.

The immediate future is cloudy because there has been no capitulation in the bear market. There has been no VIX spike. There doesn't need to be, but it is a glaring missing piece for a clear bottom. I expect a low could be around the 3700-3800 area if that capitulation comes before the longer rally. If the plug gets pulled, then it's straight down to 3400 area and then a rally.

FWIW, Xtrends thinks VIX will spike this coming week:

One day moves aren't much to go on, but crude oil broke higher. Bonds might only be pulling back within the context of a reversal. High-yield bonds did not make a new 52-week low on Friday, but came close.

BTC is right at my support line at $28,817 today. A Tehter blowup isn't necessary here, I think that could come later this year. A short-term, capitulation spike lower in stocks would be preceded or coincident with a breakdown in BTC to around $20,000 because it is believed MicroStrategy has a signficant position that will get a margin call at $21,000.

For a plug-pull, something out of the box will be needed, such as an EU embargo on Russian oil that sends U.S. oil prices soaring. Or something that breaks the bond market, but I don't expect that because I think deflation/disinflation is right around the corner.

2022-04-27

Peso and VIX

If that's an important base in USDMXN, that's also an important base on the VIX.

2022-04-07

RIP Bull Market, QT is Here

Back in 2018, I expected a big bear move. I fortuitously posted this piece the weekend before the Volmageddon (though did not expect it). End of Rally or End of Bull: Is It 1987, 1994, 1997, 1998, 2000, 2007 or 2014?.

I expected a bear move in 2022 too, before knowing what type of QT, if any, was coming. See: The Bear Pill Adding QT to this backdrop only intensifies the bearish outlook for stocks.

QT was a major drive of Volmageddon and the autumn swoon in stocks. My thesis back then (I was far from alone in seeing this) was that the market tracked the Fed's balance sheet. The percentage change in both was very similar from 2008 to 2014. When QEs ended, there were sell-offs or sideways moves in stocks. A hypothesis was proposed. 

WALCL up (the FRED code for the balance sheet), SPY up. 
WALCL flat, SPY flat (with down moves and recoveries). 
WALCL down, SPY down.

QE also suppresses volatility as Federal Reserve Chairman Powell, then Vice Chairman, explained at the October 2012 meeting:

MR. POWELL. I have concerns about more purchases. As others have pointed out, the dealer community is now assuming close to a $4 trillion balance sheet and purchases through the first quarter of 2014. I admit that is a much stronger reaction than I anticipated, and I am uncomfortable with it for a couple of reasons.

First, the question, why stop at $4 trillion? The market in most cases will cheer us for doing more. It will never be enough for the market. Our models will always tell us that we are helping the economy, and I will probably always feel that those benefits are overestimated. And we will be able to tell ourselves that market function is not impaired and that inflation expectations are under control. What is to stop us, other than much faster economic growth, which it is probably not in our power to produce?

Second, I think we are actually at a point of encouraging risk-taking, and that should give us pause. Investors really do understand now that we will be there to prevent serious losses. It is not that it is easy for them to make money but that they have every incentive to take more risk, and they are doing so. Meanwhile, we look like we are blowing a fixed-income duration bubble right across the credit spectrum that will result in big losses when rates come up down the road. You can almost say that that is our strategy.

My third concern—and others have touched on it as well—is the problems of exiting from a near $4 trillion balance sheet. We’ve got a set of principles from June 2011 and have done some work since then, but it just seems to me that we seem to be way too confident that exit can be managed smoothly. Markets can be much more dynamic than we appear to think.

Take selling—we are talking about selling all of these mortgage-backed securities. Right now, we are buying the market, effectively, and private capital will begin to leave that activity and find something else to do. So when it is time for us to sell, or even to stop buying, the response could be quite strong; there is every reason to expect a strong response. So there are a couple of ways to look at it. It is about $1.2 trillion in sales; you take 60 months, you get about $20 billion a month. That is a very doable thing, it sounds like, in a market where the norm by the middle of next year is $80 billion a month. Another way to look at it, though, is that it’s not so much the sale, the duration; it’s also unloading our short volatility position. When you turn and say to the market, “I’ve got $1.2 trillion of these things,” it’s not just $20 billion a month— it’s the sight of the whole thing coming. And I think there is a pretty good chance that you could have quite a dynamic response in the market. And I would just say I want to understand that a lot better in the intermeeting period and leave it at that. Thank you very much, Mr. Chairman.

Now let's go to the charts.

First is WALCL and SPY.

Here is WALCL and SPY from December 2008 on, as a performance chart. The increase in SPY vs the increase in WALCL. Did you know the Fed reduced the balance sheet briefly at the start of 2009? That was yet another confirmation point of the QT thesis.
If I back up the chart a few months to October, you can see how tight the fit was until Trump was elected. That is my explanation for the 2016 to 2018 run. Trump's corporate tax cuts had a meaningfully positive impact on stocks. Additionally, before QE there was no correlation between stocks and the Fed's balance sheet because the Fed's balance sheet was rising so slowly it might as well have been a flat line. We should see stocks and the Fed's balance sheet uncorrelated in a normalization scenario.

Here is WALCL with VIX. It isn't a 100-percent correlation, but anyone in the markets since 2009 will remember the 2010 flash crash, 2011 correction, and 2015-2016 correction that really got underway with the yuan depreciation in August 2015. All of which came when there was no QE. And the QT period we covered above. The repo crisis of September 2019 that was swept under the rug by stealth QE4. Here we are again with QE5 ended and QT2 about to begin next month.

QT2

Back in 2018, the Fed's QT program peaked at $50 billion per month ($30 billion treasuries and $20 billion in MBS) in October. Two months later, the Fed panicked and ended balance sheet reduction.

This time, they want to phase in over about three months to a peak of $95 billion per month, composed of $60 billion in treasuries and $35 billion in MBS.

What do you propose will happen? 

On top of all this evidence, former Fed bank president Dudley called for the Fed to knock stock prices lower as part of a tightening effort. He all but confirmed what many have speculated, that rising stock prices is the real goal of QE. By extension, if the Fed wants to reverse QE via QT, should it not want to see equities decline at least at the start? Rising stocks signal the market "doesn't get it" or that the market thinks the tightening isn't enough. Bulls cannot win because if stocks go higher, the Fed will come back with a tighter policy until the equity market finally cracks under the pressure.

Trading QT2

The Fed started QT1 in October 2017 and it wasn't until it accelerated in January 2018 that the market finally cracked. It would take until October 2018 for the broader market to finally enter a sustained sell mode. There were many trading opportunities before then. Emerging markets fell steadily throughout the year as one example. I've been posting charts of stocks and sectors I see as weak now. 

As for when the major indexes start tumbling, I posit that it could start very soon. Earnings season is coming up and I already expect there will be more warnings and negative guidance in the mode of the Restoration Hardware call. QT2 will hit in May as well and will quickly hit the maximum of $95 billion per month. Phasing in by thirds, month two (June) of balance sheet reduction will exceed the peak of QT1. If the Fed starts big and phases in two smaller bumps, May's asset sales could be on par with the peak of QT1.

In conclusion, a significant decline in equities could begin immediately if the market front runs QT. By June or July at the latest, stocks may have hit a tradable low substantially below current prices and also well below the February lows. Complicating factors include inflation, interest rates and geopolitical risk. Stocks could relentlessly fall if rates and inflation stay high, or they could experience a compressed panic drop followed by a big recovery if crude oil and the 10-year Treasury yield plummet with equities.