
![[Most Recent Quotes from www.kitco.com]](http://www.kitconet.com/charts/metals/base/copper-d.gif)


The Fall of Fiserv
-
FEEDNot long ago, one of the most persistently solid bullish stocks on the
planet was Fiserv (FISV) which, from 1990 to 2025, went up over 400-fold.
Sort o...
Showing posts with label EWBC. Show all posts
Showing posts with label EWBC. Show all posts
2022-11-02
Today's Losers
More familiar names. These all fell at least 3 percent on high volume. I shrank the list with daily volume and market capitalization limits.
A ABNB ACIW ADSK AER AMCR ANSS APTV ATI AVNT BALL BILL BL BLCO BR BRKR CBRE CDAY CE CF CFLT CGNX CHRW CLX CROX CRWD CTLT CWH CWK DDOG DLO DNB DOCN DT DV DVN ECL EL ELF ENTG ESI ET ETSY EW EWBC EYE FIVN FND FROG FRSH FTNT GDDY GH GLBE GOLD GPN GSAT GT HL HOOD HRB HUBS IDXX IOT JOBY JXN KSS LEA LNC LNTH LTHM LUMN MKSI NCNO NEM NLOK OI PARA QCOM ROK ROKU RPD RUM SOFI SSNC TEAM TEL TNDM TPX TRMB TWLO TXG VEEV VRSK XRAY Z ZBH ZI ZIM ZS
2022-03-31
Doomed Banks
As I've said with other bank posts, most of these patterns repeat over and over. Not every example is included. I'm barely into the As and I've already seen several that looks like ABCB.


For ETFs, I like the KRE April 14 $68.50 put for ultra aggressive speculators (if you like taking 100-percent losses in pursuit of 500-percent or more gains) expecting an immediate drop and the KBE May 20 $50 put for those who are highly aggressive. More charts after the jump below.


2022-03-30
2021-11-22
Banks On The Line Again
All of these charts are from the SPDR Regional Banking ETF (KRE). The performance of KRE vs SPY tracks closely with the 10-year yield.


 Some of the more interesting charts. I went through them alphabetically. There are more holdings with similar patterns, but i didn't want to make the list too long.
2021-10-04
Some Charts
ATVI bounced at very LT support. I have been short HUBS and added puts on SIVB today. No other positions. EDZ looks like a nice base, it is a 3x short of EEM.


2021-04-19
Regional Bank Follow Up
I posted this on March 19: Regional Bank Charts. Many of them have reversed, but remain near major resistance lines. The regional bank ETF remains on the cusp of a bullish breakout.


2021-03-19
Regional Bank Charts
Look at the peak 2008 candle and the March 18 candle on EWBC.


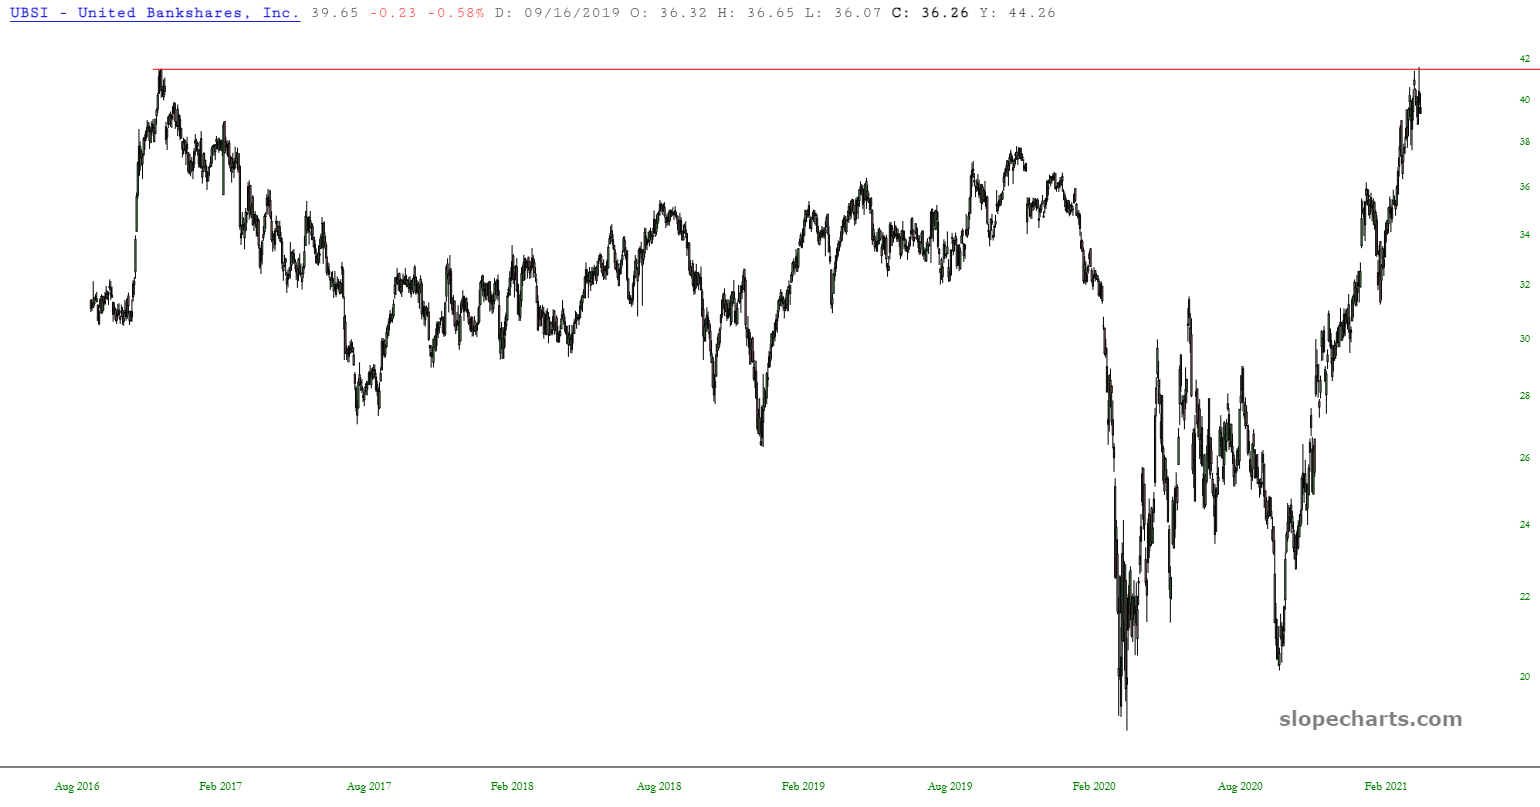
 Here are a bunch of bank charts with near perfect touches of horizontals. Many more have similar patterns but have broken higher or not reached the horizontal. If rates have peaked, financials should be pulling back. I've noticed a lot of the prior peaks also have huge wicks on top (shooting star candles), similar to the March 18 candles. Firth Third (FITB) has a horizontal touch than goes back to 2002, with a similar wick.


These charts aren't selected for being the best trade setups (although I like EWBC as a short candidate). Rather if you like what you see, dig into the financial sector. These are all culled from regional bank ETF (KRE) holdings. I didn't look at any other funds or financial sectors. Finally, note these also look like great basing patterns if you are betting that rates are going higher along with economic activity. Bank stocks performed terribly during the stagflationary 1970s.


2019-10-31
Subscribe to:
Posts (Atom)

