Showing posts with label NQ. Show all posts

2023-03-15

Financial Stress Like in 2020 and 2008

I covered BXMT a few times last year. It was one of my "crash" targets. It is rolling into crash territory now. Some resistance around, conservatively, $16.50 per share. Below that it can free fall. If that happens, we'll be in a full-blown financial crisis of some degree.
The other side of the market is the Nasdaq. The NQ continues holding up. It needs to break 12000 and not look back for a full-blown bear move to get underway.
The Nasdaq's reslience, really the whole market's, speaks to the still extremely bullish sentiment within the market and the trillions of inflated liquidity sloshing around. The behavior of banks, commodities and so on are now hinting that this money will be deflated and sent to money heaven. Investors can hedge risk of bailouts and supercharged inflation with assets such as gold. Until there is some major pain however, I do not expect the Federal Reserve will go into full bailout mode because it will risk, with signficant probabiity, even higher readings the inflation indexes. If inflation goes up and rates with it, more banks fail. If inflation goes up and the Fed does what they did for SVB Financial, inflation goes higher still and takes down the whole economy. They're trapped and so are all the bulls that aren't hedged.

2023-03-09

Go Time for Bears if 12000 on NQ Falls

NQ still battiling in that area. I'm encouraged by the collapse in the peso though. It gave way intraday and is below where I first said to short it.

2023-02-10

Palladium Flirting with Final Support

It is at the late 2021 low and broke long-term support above this month. I am not shorting palladium because Russia is a major producer and geopolitical outcomes could be wild, but rather as a leading indicator for the Nasdaq.

2023-01-26

Palladium Breaks Support

Here are prior posts where I used palladium as a signal to short Nasdaq.

Who Wants to Short Commodities?

Nasdaq and Palladium

The Top is Coming

There can be a large gap in time between the moves. I view palladium as the leader here because it broke a major topping pattern. If it recovers, perhaps Nasdaq is leading short-term. A palladium and Nasdaq top are consistent with what I expect for a bear market and transition to new bull market with new leaders.

2022-11-15

Hello Deflation

The October PPI report was bullish for stocks. The market should love than news and run higher this week, but there are signs of weakness. I was caught wrongfooted opening short positions yesterday, but I might have been early instead of wrong about the rally completing.

The exhaustion I saw in the market yesterday was wiped out by the morning’s response to the PPI. Most people are not looking at China and other data sets showing the clear tilt into deflation underway and more oncoming in 2023 once housing data trickles through. At least through the PPI release, the market is still viewing falling inflation as bullish.

The core PPI services segment went negative in October.

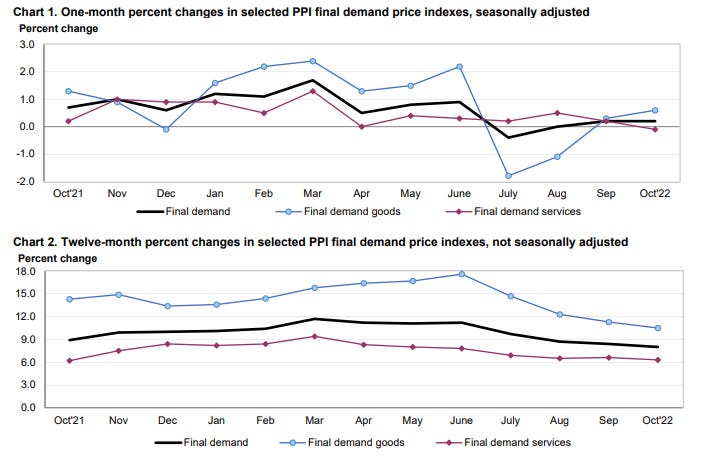
There’s one potential paradox: speculators have been bidding up commodity prices in response to lower inflation readings. Will that continue? Today’s initial response was a jump in commodity prices that quickly reversed. It will be telling how this plays out today. If copper and oil continue sliding, it may indicate the market has started realizing the downturn in prices and slowing pace of Federal Reserve rate hikes might not be bullish.

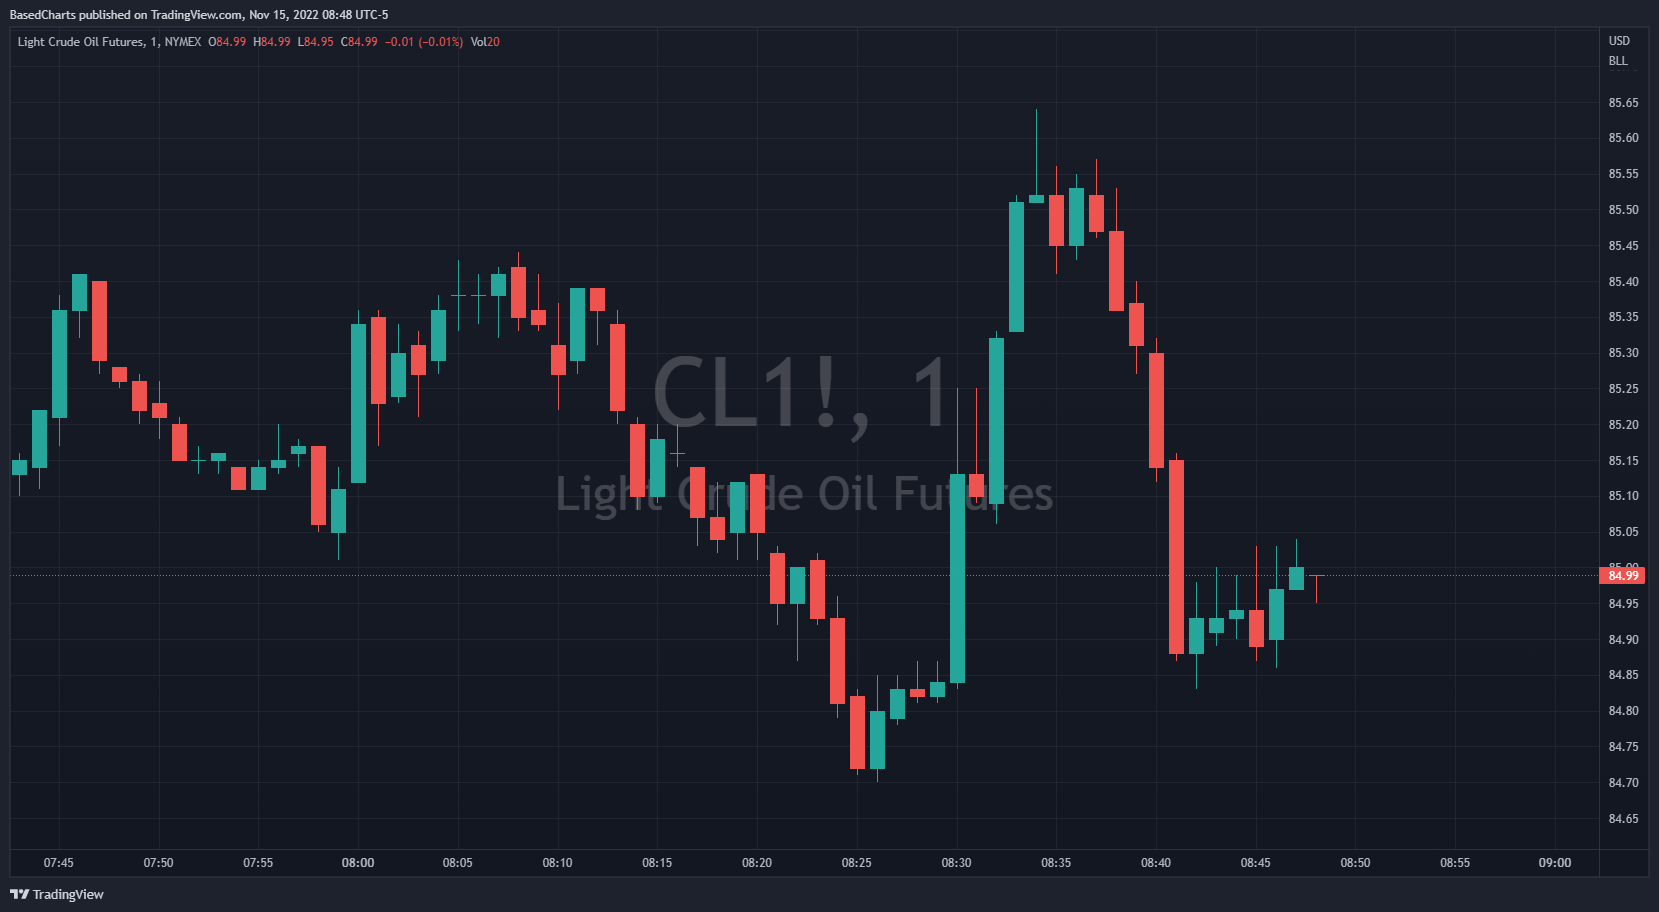
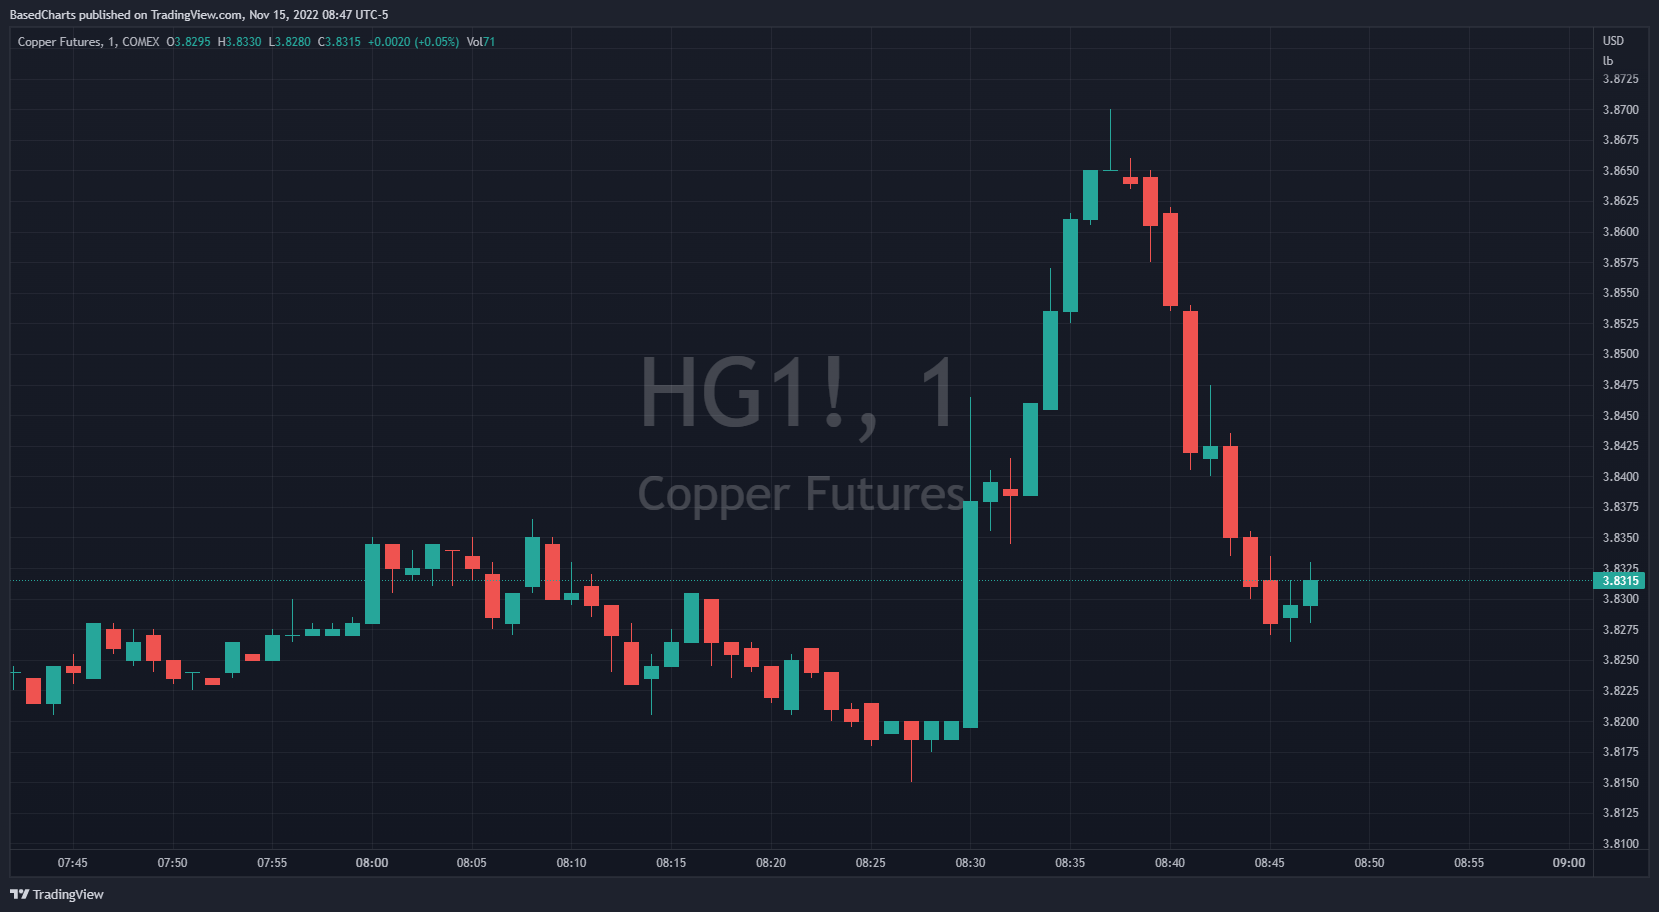
Stocks reacted far more positively because there’s no sign of recession yet. Falling commodities without a recession would be positive for GDP growth, consumer spending and limit Federal Reserve rate hikes. It would be a move back towards the “Goldilocks” economy that stocks love.

If instead stocks and commodities start sliding, it will be evidence the market has moved beyond inflation worries and started on deflation worries.

Yesterday I opened a bunch of short positions having seen exhaustion on the tape. I’m going to be underwater at the open, but notice the line on the NQ chart. I have two resistance lines on the NQ at 12100 and 12200. Right here, my thinking is to add more shorts at 12200 if it can get there, but cut loose all the short positions above.

2022-10-31

Palladium and Nasdaq, Unhappy Together

My bearishness is intensifying.
Bonus: another sign that platinum's time is coming.
This chart from Slope.
From Stockcharts, the line from the 1980 high hits 2000 and the recent high:
Related posts:

Palladium Signals Top at $3200

The Top is Coming

Palladium Still Calling Tech & Palladium Top

Is The Bull Market Over?

2020 pre-covid panic: Palladium's Pendulum: A Third Top in Time and Price?

2022-09-01

For Posterity, the NQ WAG of Summer 2022

Will be deleting the drawing.

Last Line of Support for Bonds and Stocks Approaching

The lower line on NQ is there because the prior rally stalled around that level. The upper horizontal is from March 2021. The bombay doors are open below 12100 with only the prior low as support. I wouldn't press shorts in the short-term though because the market has been trending lower for days. Squeezes are always a problem for bears. I have most of my puts on from two weeks ago or earlier.
My post yesterday about Bonds Getting Ugly Again was well timed. ZB tanked when futures opened at 6 PM and then tanked again this morning. Perhaps the market is front-running the jobs number?
Bonds are very important here. That failing inverse H&S pattern, that rolling over move, is what was seen throughout the first half of the year in stocks and bonds. If bonds break lower, then selling from the first half will quickly resume. The more the market slides every day with no bounce, the more likely a short-squeeze or a "crash" is coming. Either the lows bring in dip buyers who squeeze heavily shorted securities or the breaking of lows triggers brings in new sellers with speculators arleady loaded with shorts. The fastest drops occur when markets go bidless.

The U.S. dollar is already at new highs versus JPY and KRW, threatening new highs vs the euro and yuan. As I said when discussing bonds yesterday, these moments are often when trends fail because continuing them causes major phase shifts. If the dollar goes higher from here, an entirely new leg of dollar strength could unfold. Stocks take out the lows, bonds take out their lows. I do not expect this will be orderly as it was from January to June, but resemble something more like a panic or multi-week crash.

Possible scenarios:

1. Dollar soars, stocks collapse, bonds could trigger a crash if they also sell-off and fuel explosive up and down moves in DXY and stocks/commodities, respectively. Or bonds could flip back as commodities plunge. Something major might blow up, like the Chinese yuan suddenly depreciates.

2. Dollar reverses, stocks collapse, bonds crash as Fed accelerates hikes amid soaring commodities, crashing dollar and soaring inflation. (Inflationistas win!)

3. Weaker economy triggers bond rally, inflation fears fade, stocks squeezed as less bearish picture emerges and economy not weak enough (yet?) to warrant selling on recession fears. A resumption of the rally that started in June.

2022-08-31

The Crayon Has Limits

I am of two minds here. One, ZB and TLT aren't dusted yet. This is an area from which a rally can begin and that comports with a very bearish outlook for equities and my forecast of deflation hitting.
The second thought is that normalizing monetary policy requires permanently higher interest rates. In one sense, the Federal Reserve's QE policy is life support for the bond bull market over the intermediate-term, arguably long-term if we're talking about financial market cycles. In the immediate present, running QE in reverse (QT) at around 80 percent of peak asset buying should be highly deflationary and push rates lower. Evaporating buying from the Fed will initially be overwhelmed by "safe-haven" buying by traders, seculators and investors.

My Nasdaq WAG is complete. I don't expect a crash lower, but I do think the best time to short was August 15 and 16. My last major trades ahead of vacation were on August 15, adding more AAPL 140 puts and SPY 380 puts for October.

Crude oil has been quite volatile. I still expect there will be a $60 handle sooner rather than later.

2022-08-28

The Purple Crayon

I amaze myself. These were WAGs, not serious forecasts. I did move the apex on RTY up by a few weeks, to August 19 opex, but otherwise I didn't touch these drawings.

Harold and the Purple Crayon

The protagonist, Harold, is a curious four-year-old[1] boy who, with his purple crayon, has the power to create a world of his own simply by drawing it.
Of the majors I track, NQ, ES and RTY, the reversal in the Russell 2000 looks best to me in terms of signaling a top is in.

2022-08-17

ZB Giving Me Headaches

I don't think the direction of ZB matters for stocks in the longer-term bear market. Higher rates will kill sectors such as housing and eventually trigger a major recession that probably sends bonds soaring for a time. It matters for how the bear unfolds in the short-term though. It also will help determine the worst performers aka the stuff we want to be shorting. It looks like it is taking on a bearish shape, but that isn't decisive yet.
The Nasdaq is leading the way lower as ZB declines.
Crude oil top is complete. USO is hanging around long-term support, while CL sits below a similar line after failing at resistance. Crude should have a breakdown soon and because I'm expecting stocks will decline here, I'm trading it via XLE. If crude doesn't break down, that could be bad news for ZB and NQ, while a drop might be bullish for a time until the market starts worrying about deflation.

2022-08-16

NQ Drawing Visible on 1-Min Chart

My top drawing was a general drawing, it holds no specific value other than the right shoulder is near a 25-percent rally target for the NQ. I do think the market is topping out here and I suspect it could be the top-top because of how extreme the momentum readings became. As I said yesterday, as long as you're buying out into October you're in good shape. Now's the time to be picking up cheap puts.

2022-08-12

One Chart Shows it All

Crude down, long bonds up, Nasdaq up. They're all correlated tightly here.

2022-07-27

That Nasdaq Top

I wanted to look at the Nasdaq 100 (NQ) potential top unfolding. If the rally could get to 25 percent, which I sort of doubt happens here, but lets say it gets there by August. It sets up a symmetric top with a left and right shoulder forming about 9 months from the top. If the market achieved the measured moved down, it would be a 37 percent drop from the neckline and 45 percent from the 25 percent rally line. Something for the bears to remember in case the rally goes on into August...

2022-07-21

Another Look at TLT, Short Apple

TLT basing off a big volume area. My portfolio is currently 25 percent in TLT related calls and 12 percent in USO related puts.
ZB and NQ are very similar, both attacking their early June consolidation area, but I think ZB/TLT can pop without NQ following if the next pressure on stocks comes from recession fear rather than inflation fear.
I shorted Apple late in the day. As I said this morning, I was looking for the bearish side. I lost money trying to short around 3980 on the S&P 500 and Nasdaq, but will see how it turns out. I don't think the final blow-off phase of the rally is underway. If I'm wrong, I should do fine with TLT because today's rally was partly fueled by the pop in bonds. I like the candle on Apple for a reversal.
I held on to XLC and it may be wrecked come morning. SNAP is down 15 percent on earnings after hours and crushing META and GOOGL along with it.
Crude oil looks fine, still holding here.