


Palladium Signals Top at $3200
Palladium Still Calling Tech & Palladium Top
2020 pre-covid panic: Palladium's Pendulum: A Third Top in Time and Price?

![[Most Recent Quotes from www.kitco.com]](http://www.kitconet.com/charts/metals/base/copper-d.gif)
|


Palladium Signals Top at $3200
Palladium Still Calling Tech & Palladium Top
2020 pre-covid panic: Palladium's Pendulum: A Third Top in Time and Price?


Prices of palladium and rhodium are poised to rally for years as a supply squeeze tightens for the metals that are key to curbing vehicle emissions, said the head of the world’s third-largest producer of platinum group metals
Platinum prices, for which South Africa is the world’s top supplier, are likely to remain subdued in the medium term until automakers switch from using more palladium in catalytic converters, he said.The chart and some cycle events argue for platinum. First the chart.

The platinum analog playing out now would be the 2001 low before the bull market entered its manic phase. Platinum bottomed two years earlier, rallied and then consoliated those gains. A proportional conslidation would take platinum down into to the $800 to $850 area.


The best looking chart to me is copper vs TOTLL. Held the pattern.
I calculated the implied price of every commodity assuming it reverts to the ratio peak vs M2 or if there's a trendline, tags support (for M2 divded by commodity price). These are conservative targets because it does not assume any growth in M2 and assumes no pattern break. For trendlines, I went out to Dec 2026 (6 years), that's simply my default setting for charts. Not suggesting a timeframe. IF it gets there sooner on a trendline, the price would be higher.
Gold $2525
Silver $67
Palladium $4084
Platinum $4570
Copper $10.88
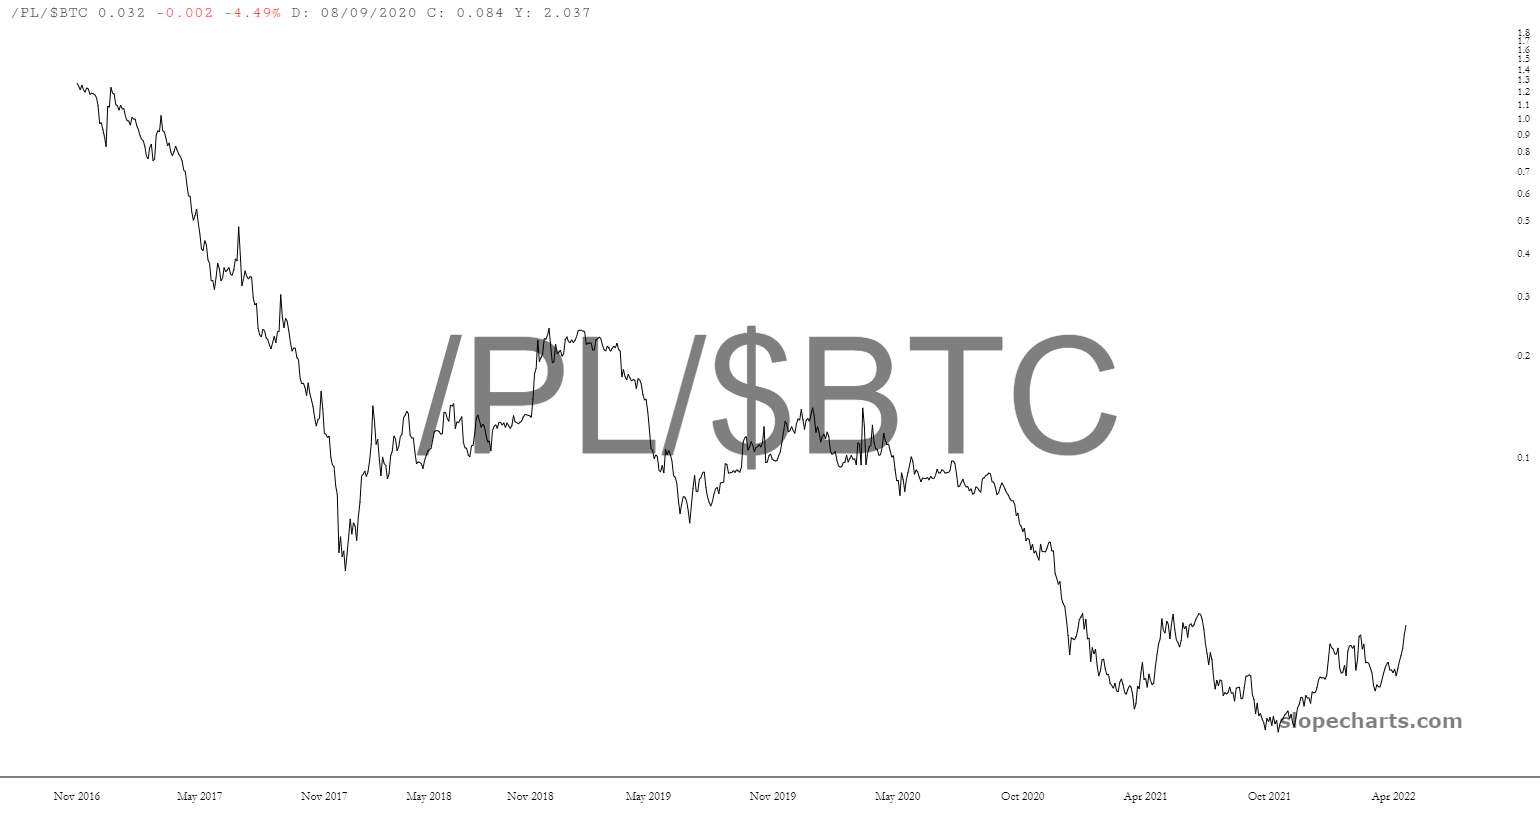
Caveat to all: ratios can be broken, as the palladium chart shows.


The U.S. Dollar Index has likely entered a bear market. The prior two bear markets saw 7 to 8 near-consecutive quarterly declines (the rebounds were small bumps on the road lower). A reversal to 96 is a correction, above and we're probably discussing widespread financial panic. The last stop for a rebound is the 88.50 area. If a bear market, the DXY should be sub-80 by year-end. Fundamentally, all the conditions for a relative dollar rally against foreign fiat are still in place, but it's a question of whether those fundamentals have been overwhelmed by animal spirits. Coming into 2021, the indication is yes.


