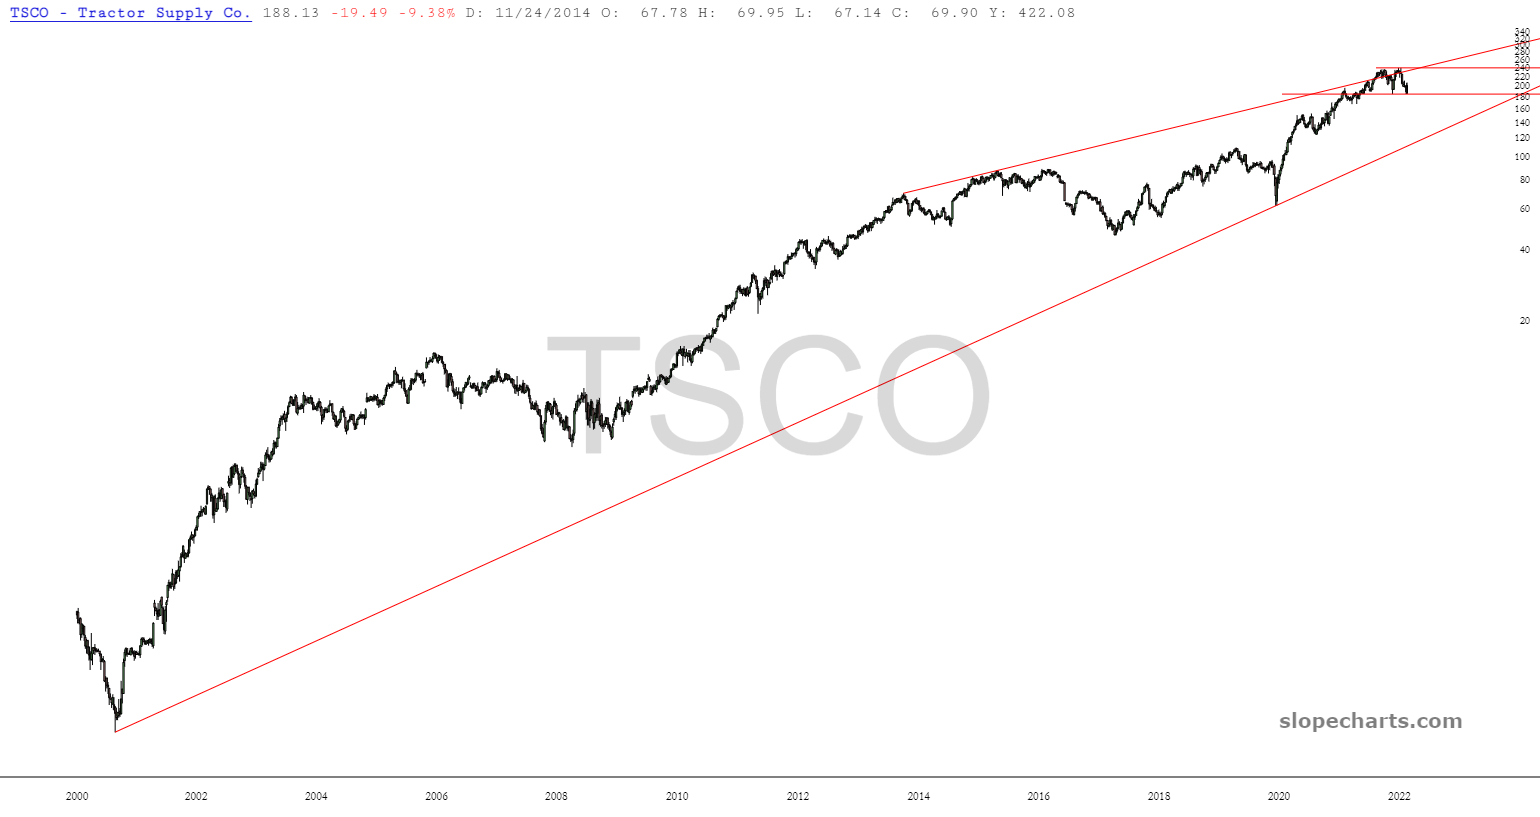
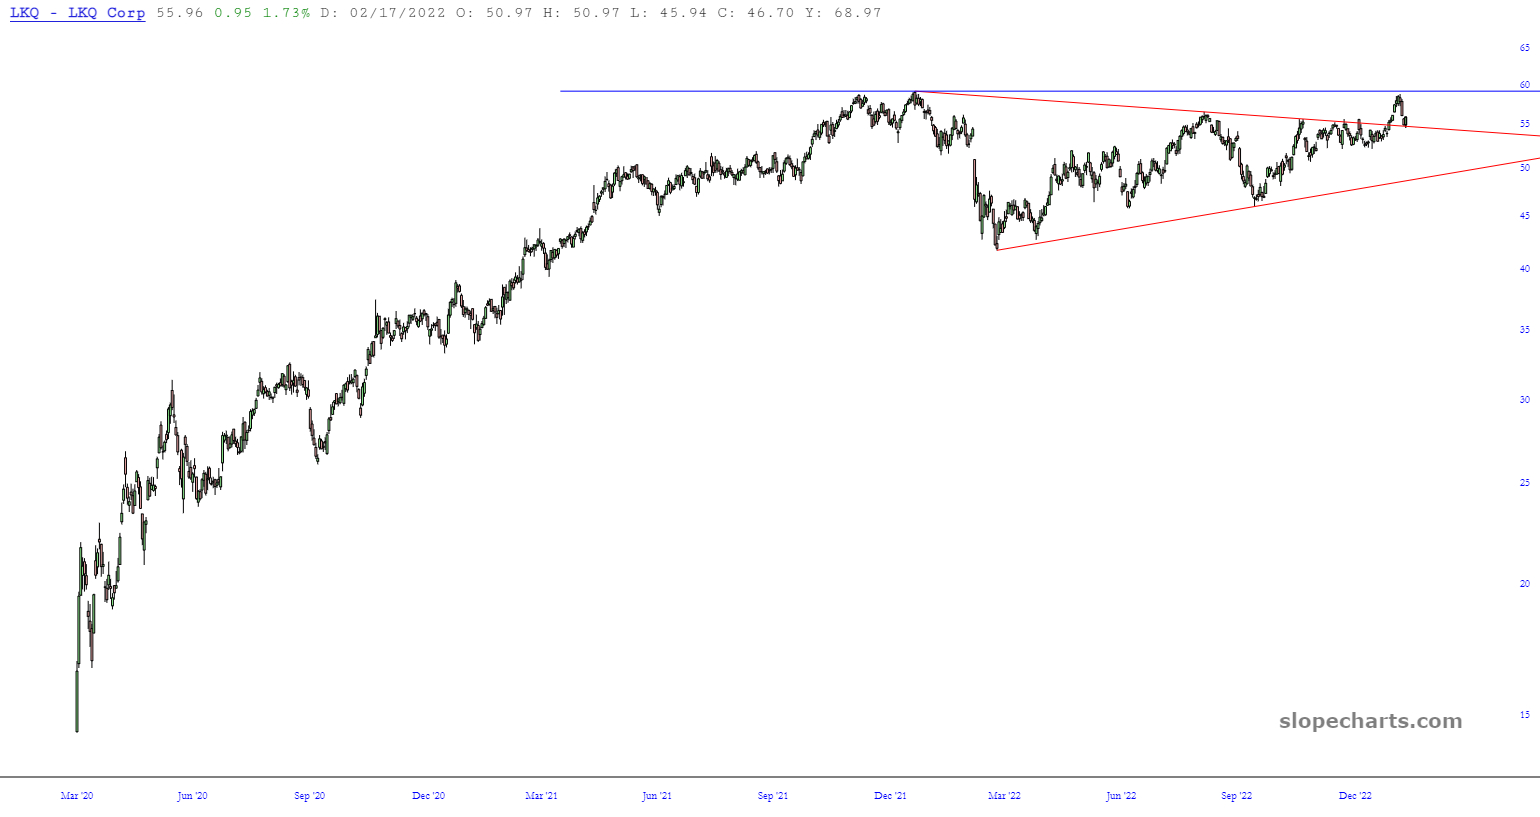
A look at some charts that moved towards a breakdown or have broken down. Northman Trader noted that going back to May, all months except October and November saw weakness into opex. Bottoms were on the Wed before to Monday after. Given the current position of the charts, opex weakness would be the push needed for a break through support and send both the Russell 2000 and Nasdaq to their lowest levels in months.
Charts are after the jump. A lot of more that I've covered in the past few weeks are in "no man's land" without support or resistance nearby. Some are forming new h-patterns. For these, I watch the broader market. They could bottom whenever the broader market bottoms and they can collapse if the broader market slides.


![[Most Recent Quotes from www.kitco.com]](https://lh3.googleusercontent.com/blogger_img_proxy/AEn0k_uR4fzdje74Wf9NFSGpIwMsercdloA5yqtdN0KU2uumpL5zMf-8MLNq27WAMP83r5EH04RD9UsjuBYQSj-n83KC374IHZvbvCGHu2rohRXHqqouYntk-JEPr3Q=s0-d)