Showing posts with label MSFT. Show all posts

2023-07-18

Nasdaq Rebalance

US funds hit limits on holdings of high-flying tech stocks
Major asset managers and mutual fund specialists such as Fidelity, BlackRock, JPMorgan Asset Management, American Century and Morgan Stanley Investment Management have run into strict regulatory limits that determine whether a fund can be categorised as “diversified”. The trend is a further sign of how a lopsided rally powered by just a handful of big companies is creating unexpected issues for investors and index providers, and follows news that even the Nasdaq 100 — the index most closely associated with high-flying tech groups — will be rebalanced to reduce the dominance of the largest groups such as Apple, Microsoft and Nvidia. The S&P 500 has added 18 per cent so far this year, but seven large tech stocks have accounted for the majority of the gains. Mutual funds that register with the Securities and Exchange Commission as “diversified” cannot put more than 25 per cent of their assets into large holdings — with a large holding defined as a stock that represented more than 5 per cent of the fund’s portfolio at the time of investment. Funds are not punished if the value of their existing large holdings naturally rises past the 25 per cent limit, but once it is hit they cannot buy any more of the affected stocks. At the end of May, Fidelity’s $108bn Contrafund, for example, could not buy any more shares in Meta, Berkshire Hathaway, Microsoft and Amazon, because they made up a combined 32 per cent of its portfolio.
I covered this topic several times last year, most recently here: Why You Shouldn't Own Apple Stock and even more recently on the Substack: Me in April: Microsoft Done, QQQ Fails Diversification Rule

The Nasdaq 100 will undergo a rebalance because of this issue. My view is this is the sign of a massive market top. Last time this became an issue, the market solved it in March 2000. That this is going for almost 5 years now, going back to the 2018 major sector shuffle, indicates this could be a far larger top in time and price. The alternative explanation is the United States is becoming a techno-fascist country with emerging market qualities. For example, Taiwan Semiconductor is around 40 percent or more of the Taiwan market capitalization.

2022-09-19

How Big Was the 2021 Top?

I've been having a 1929 vibe all morning looking at linear charts.

2022-06-16

Doomed Markets, Doomed Economy

Here are various trash indicators that, if they go, will unleash total capitulation in the markets, a waterfall crash. A link to view them updated.
The other asset to watch is BTC. Will $20,000 will hold? There's really no floor for BTC once the financial system starts blowing up because most of the DeFi will be wiped out without Fed support, and there will be no Fed support.

2022-04-26

Air Balls

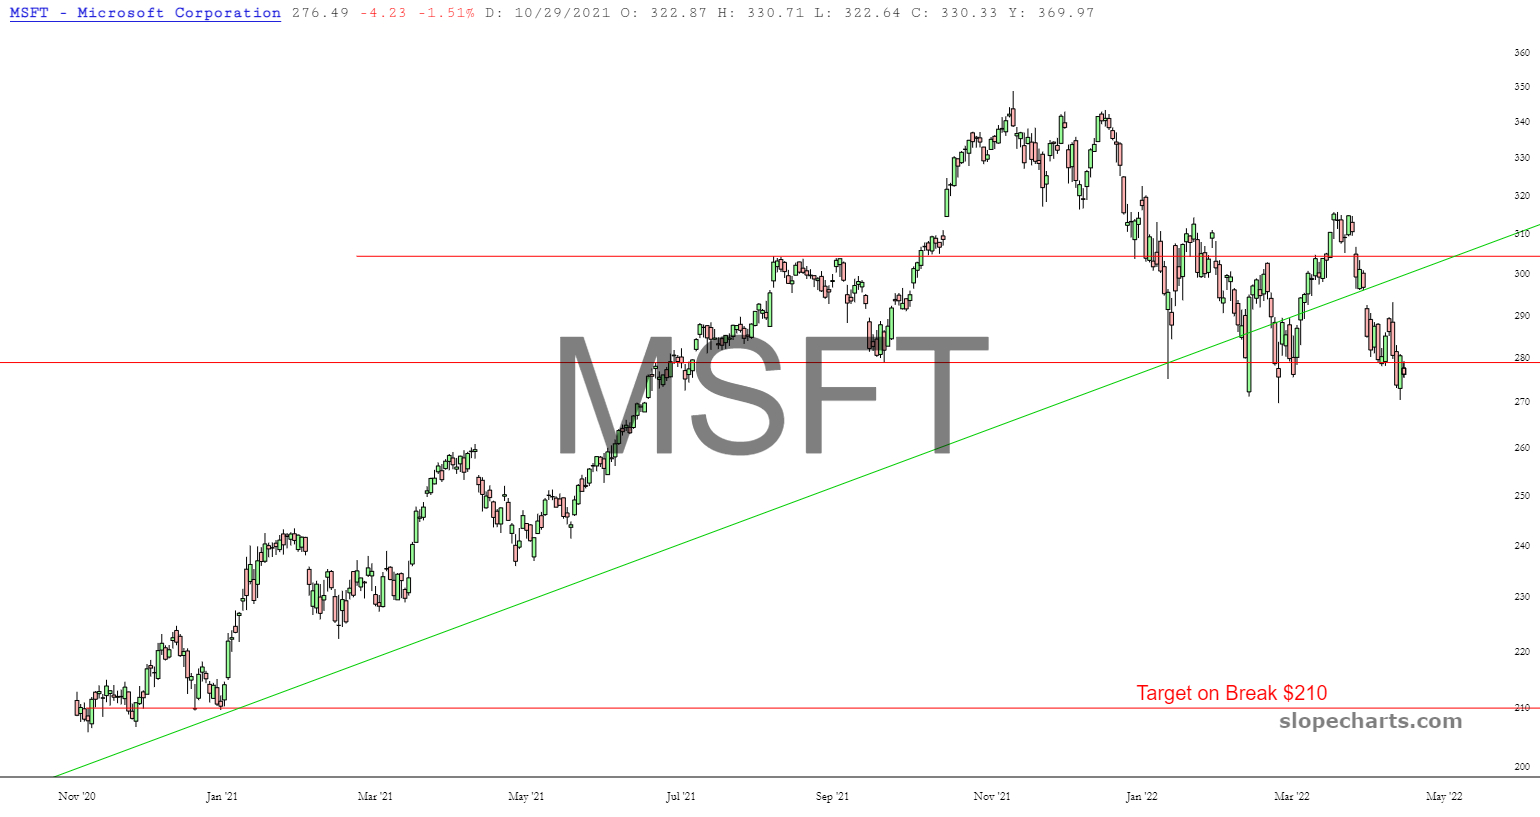
The setups are incredible again. The next move will be big in either direction, but a move down will be far larger and far more important. It is a new wave of selling if these stocks break lower. A short-term rally may require positive earnings. Google and Microsoft report today.

2022-03-22

2022-02-20

Mushroom Cloud Software

Technology advances such that what was once expensive becomes so commonplace one doesn't even think about it. If you are of a certain generation, you may recall "Game & Watch" versions of Super Mario or other popular games that were simplified versions on cheap LCD screens:
Today, there is a "Game & Watch" with Legend of Zelda games, the complete versions that ran on game systems such as the Nintendo and Super Nintendo.
In software, what was once expensive becomes cheap or even free. Nintendo's games and characters survive because they are copyrighted, but more importantly, popular. If another could make Mario games, Nintendo would be in deep trouble.

In the case of productivity software, the most important function is the task itself, which cannot be copyrighted or patented. "Paying a bill" is not a patenable function. Some have tried, like Amazon patenting "buy with one click," but that is more evidence of USG corruption than a repeatable busines model. Moreover, the shift to the cloud makes switching software easier than ever. If blockchain realizes its potential, consumers will gain more control over their data, forcing companies into greater competition for customers.

Many software and platform companies are valued on their platforms. Their growth is a function of the customer base growing into the future and collecting more dollars from their users. Instead, most are headed into a future similar to Docusign. Innovative to start, how much should it cost to digitally sign a document? What's to prevent competition? This is the classic case of a company built on a feature that will ubiquitous and free. The market has already figured out that day is coming:

I haven't done a deep dive into software companies. That is for after the decline, when picking the survivors will deliver great profits. For the foreseeable future, most companies will suddenly be valued as if Docusign's fate is their future.

2022-02-17

Apple is Doomed

I've been mulling over the fact that Apple and Microsoft Hit Their Natural Limits.
I tried to think of another stock that surged as a share of the index in a bear market, and I can't. The major tech stocks declined when the dotcom bubble burst. The best case for the Apple bulls might be Exxon Mobil, which peaked at the market low in March 2009 versus the S&P 500 Index and in December 2008 versus the Nasdaq.
Theoretically, Apple could behave the same way, but I doubt it. I expect that tech will be a driver of the bear market. Apple is heavily weighted in most growth and technology funds. Apple is already at its "natural limit" because of SEC fund regulations. If Apple outperforms in an up or down market, managers will be forced sellers.

If you know managers have to sell Apple, do you want to be buying against a wall of forced selling? It creates a paradox because the logical move is front-run the selling (cause Apple to underperform), which obviates the need for forced selling by managers. However, there is no paradox on direction: Apple faces a headwind of sellers one way or another.

There's another factor in play: capital flows. Bulls have been buying the dip. The relative performance of Apple shows money went into Apple. What will a growth-fund manager sell if redemptions start coming in? Will they sell a stock hitting regulatory limits or sell something like Facebook that's already down 40 percent? I can't imagine meeting redemptions by selling the more illiquid holdings such as cloud software. A large fund company like Fidelity or Vanguard would probably cause 20-percent or larger drops in a day if they tried unloading those stocks in heavy selling. Whereas Apple is kind of like gold right now...it went up more than the overall market in the rally despite holding up in the first wave of selling. If forced selling begins because of redemptions, stocks such as Apple and Microsoft are the obvious top candidates for raising cash or meeting redemptions.

That isn't to say Apple will be the worst performing stock, but if I'm correct in my assessment, options on stocks such as Apple and Microsoft are cheap relative to their potential losses. As for the leaders on the downside, I would bet on the Facebooks and Teslas. The Facebooks are stocks that have been hammered. Some fund investors will question why the fund still owns it when it's obviously a bad stock. (Note these are the same people who, if they found out the fund didn't own Facebook in December, would have been calling for the manager to be fired.) The Teslas are the speculative stocks that in hindsight, no manager can defend owning. These are stocks that funds will be looking to drop out of the Top 10 holdings list ASAP. A stock such as Shopify might have landed in that category already:

Stocks such as Shopify also make the case for a weaker Apple. Shopify is down 63 percent from its high. Managers might want it off their books. It looks like a trip back to $300 (the March 2020 low) is likely. But how much can they sell and would they sell into a panic sell-off?

There are no good choices for growth managers because they are trapped, but that's why as with ARKK last year, it will be very profitable to game which stocks are going to be sucked down the drain when the panic sets into the large-cap technology space. Or which stocks might be very good options plays even if they outperform the sector, because the sector itself is going down the drain.

2022-02-16

Apple and Microsoft Hit Their Natural Limits

Funds may start outpeforming again thanks to BigTech become so large a slice of the market that it runs afoul of SEC diversification rules.

Morningstar: Why Some Fund Managers Have to Bet Against Apple and Microsoft Stock

Diversified managers face a real conundrum when it comes to the index's top two stocks, especially. No matter how bullish they are on Apple and Microsoft, they have almost no wiggle room to overweight them. Instead, it leads many of them to bet against the two by owning proportionately less than the index. In fact, all 55 medalist strategies collectively underweight the two stocks. That could hamper these strategies if Apple and Microsoft continue to outperform the broader index and their managers can't find opportunities among relatively smaller companies to make up for the lost ground. This issue affects most large-growth fund owners; of the $1.8 trillion of mutual fund assets in the large-growth category, $1.4 trillion sits in officially diversified mandates.
It's a well written article that explains everything. If you don't want to read it: the SEC has some quirky diversification rules. The bottom 75 percent of a portfolio cannot hold more than 5 percent in any stock. Apple and Microsoft are 23 percent of growth. THe rest of tech adds up to 50 percent of the Russell 1000 Growth Index. This means there's 2 percent to put somewhere, and then Everything else has to be under 5 percent. Growth is highly concentrated in BigTech though, which requires a decision of which BigTech stocks to underweight. Also, Apple and Microsoft cannot keep outpeforming because assume managers are sticking as close as possible to the index. They have to sell if these two go over 25 percent of a fund such as SPDR Technology (XLK). Only in a scenario where you have some big new investors coming in gobbling up Apple and Microsoft shares (leave aside that these companies also have to take over the global economy) could the demand offset the selling pressure. Once you realize this, it's pretty clear these stocks have to underperform. Then you think to front-run the crowd and away it goes...
And then there's Facebook, solving the problem itself.

2022-01-30

Market Becames More Reliant on Apple

The stock market has spent the past three months becoming ever more reliant on Apple. As a result of Apple's relative strength, it is now 24.15 percent of SPDR Technology (XLK) and 11.64 percent of the QQQ. Microsoft is 21.91 percent of XLK and 10.09 percent of QQQ. The next largest holding in each fund is Nvidia 3.76 percent and Amazon 6.76 percent.
If Apple plunged to $110 this summer, it would't violate the uptrend in place since 2002. Microsoft could be cut in half and it wouldn't violate an uptrend in place since its IPO in 1986.

2022-01-21

BTC and SMH Break, Amazon Loses 2008 Trendline

The two strong horses are broken, semiconductos and BTC. Apple is broken. Nvidia. Facebook. Microsoft. Paypal. Google is rolling over. Amazon broke its 2008 trendline. Nvidia. The stocks below are the top-10 holdings in the Nasdaq 100 ETF (QQQ). Previously, this setup was almost always a bear trap. It feels like the bears know this, so I believe the risk of a major plunge today is higher than normal. Right now, I plan to be back in cash by the close. I am currently at 67 percent cash.

2021-12-11

The Bear Pill

At the risk of looking like a fool, I'm calling the top. I do not know the day the Bear will come to the headline indexes, but I sense his arrival is imminent. I have written about this over the past month. Posts such as This Might Be A Big One. I made a disinflationary/deflationary case in Asset Inflation Is Over, For Now and an inflationary one in Inflation Bu Hao, Very Bu Hao. I'm well aware that I may be suffering from confirmation bias, but I think the reason I see a down market outside of a "Goldilocks" scenario is because sentiment and valuation have finally peaked. At the top of Everest, it doesn't matter which way you go: the next step is down.

I think market tops and bottoms are sometimes crystallized by a narrative or meme. Not always. The top in 2007 was kind of uneventful, but Citibank cutting its dividend a month or so later was a sign of the major trouble coming to financials. I distinctly remember a chart of money market fund totals going around on the Friday before the market bottom the following Monday in March 2009. I also remember people talking about General Electric going bankrupt that Friday. I remember thinking in the back of my mind, "This is probably the bottom." I didn't act on it, but I remember it. This post is what has me thinking, "This has to be the top."

On to the Bear Pill.

Yesterday, someone on social media was asking why the market is at new highs and they are down big. I went searching for "stealth bear market" because that was a popular term starting around 1998. Blue chip stocks were not rising with the market because gains were increasinly concentrated in tech. I came across this post from Top Gun Financial: The Stealth Bear Market And The Nature of Bull Market Tops.

I want to focus in on the epic tops of 1929 and 2000 because I think they are most similar to what we are seeing now. As you can see, when the market topped on 9/3/1929, 32% of stocks in the DJIA were already at least 20% below their highs and 19% were at least 30% below. On 1/14/2000, the numbers were 55% and 32%. These compare favorably with the numbers cited from Strazza’s post earlier on the NASDAQ in my opinion.
He's referencing what he wrote above in that post:
It starts with an excellent blog post by Steve Strazza of All Star Charts today entitled “Are Stocks In A Bear Market?” While the overall NASDAQ is less than 5% below its all time closing high from September 3rd (15,364) at today’s close, beneath the surface there is carnage. As you can see in the chart above, 51% of NASDAQ components are at least 20% below their 52 week highs and 25% are at least 50% below their 52 week highs.
I don't know the current numbers, but given the declines I've seen, I assume the numbers are worse now.

Going a little deeper into a top comparison, here's the one-month performance of the S&P 500 sectors:

Tech is up there and that's not exactly bearish, but communication services is rather tech-heavy with stocks such as Google and Facebook. Consumer discretionary has about 40 percent between Amazon and Tesla. On net, tech is taking on water. Consumer staples, utilities and real estate are all "defensive" sectors. Defensive is a misnomer because these sectors will all decline in a bear market, but they go higher during the topping process because nervous investors buy them.

Here are charts of the utilities and consumer staples SPDRs in 2000, and then compared to technology. Utilities peaked in November and staples in December. Both made their all-time high 8 to 9 months after the dotcom bubble had burst. Between March 24 and December 29, 2000 (simply the slice I grabbed when highlighting the chart), the returns for XLU, XLP and XLK were +32 percent, +41 percent and -51 percent.

Here are the same charts now. Utilities and consumer staples are trailing technology.
XLK has run up, but perhaps FDN is more representative—it peaked in July. For my money, ARK Innovation ETF (ARKK) is the appropariate stand-in. Against these funds, utilities and staples have been leading since February (ARKK) and July (FDN).
As of this moment, utilities peaked in September. Staples broke out on Friday with a big green candle. My explanation for this: many investment managers have a mandate that requires they remain 100 percent invested. As long as money is coming in, they have to put it somewhere. When utilities and staples start leading, it tells you they are nervous. Buying has shifted.
Going back to that one-month performance chart. What exactly has been driving strength in technology? Apple, and to a lesser extent Microsoft. The former is 23 percent of XLK and the latter 22 percent for a whopping 45 percent of the tech sector. Behold, the 1-month heat map of the S&P 500 stocks:
The gain in Apple alone is about 4.9 percent of the tech sector's gain. Back it out, and technology was down 0.4 percent in the past month. Microsoft was another 0.75 percent of performance. Both stocks are still in bullish uptrends. If they keep rising as they have, tech, the S&P 500 Index and Nasdaq could still rise. Can they keep rising? Microsoft has better technicals, but Apple is overbought on the daily, weekly and monthly timeframes. All it will take is a simple reversal and,
The "bull market," such that it even exists, has been all Apple the past month. Back it out and the S&P 500 and Nasdaq join the DJIA and Russell 2000 in the red for the month ended December 10.

The bull take is Apple signals the market is still bullish. Everything else will recover and the market will go on to new highs. Narrow markets in tech have happened a few times before in recent years and they always resolved higher. "This time is not different."

The bear view says the S&P 500 new all-time closing high made on Friday is an illusion created by one stock. It isn't a case of cherry-picking when the cherry is this big. The market is propped up by a handful of stocks with large weightings in the indexes. Apple and Microsoft are 6.92 percent and 6.32 percent of the S&P 500 Index. When one or both reverse, it will be like pulling the plug in the bathtub. Everything is going down.