2022-01-31

Should We Leave the Ark Alone?

ARKK was a great target for shorts over the past year, but does it still have good targets? I decided to hone in on the stocks that ARK controls 9 percent or more of, along with ROKU, EXAS and PATH which are top-10 holdings of significant size. I calculated how many days of average volume it would take ARK to sell out of its holding. The largest of these are MTLS, DYNS, QSI, SGFY, PSNL, VCYT and BEAM. It would take ARK between 10 and nearly 19 days to clear out its holdings at recent average volume.

A bunch of stocks on the list are low priced and/or recent IPOs. Of note, several of the charts have vertical plunges. The charts below look the most interesting, but not all of them are good short candidates for various reasons. I'd hone in on the larger cap ones with options for myself. Worth noting that a lot of these are biotechs and they look like the biotech ETFs, pasted below. 

MTLS DYNS QSI SGFY PSNL VCYT BEAM MASS NTLA SURF FATE ARCT CGEN PATH PACB BLDE PD EXAS BLI SSYS TWOU CRSP NVTA CND TDOC VUZI ROKU

Here We Are Again

From one of this weekend's chart posts:

XLE Holdings

Chevron fell after earnings. Exxon reports tomorrow. My hunch is that tomorrow will mark the peak for XLE if Exxon makes the market happy, or already peaked if Exxon disappoints like Chevron.

Trudeau Accuses Freedom Convoy of Stealing Food From the Homeless and Racism

It's over. Yes, there's a lot of work to be done and it won't be easy, but this is a sign that it's all downhill from here, like after the Battle of Midway. He's not defending SARS2 lockdown policies and the rest, only making wild accusations. Whether he knows it yet or not, he's admitted he lost.

Doubling Down on STLD

Trying Another Short

Out of my Russell 2000 long for the moment and short. Tight stops though. The Nasdaq has the best setup for a rip higher, the question is will it come? I will 180 on a dime if I'm wrong here because the alternative is a face ripper higher.

Bounce

If 2040 can fall today, it'll scream bear rally.
The blue horizontal on this chart is around 2020 on RTY. It's about halfway to the resistance area. I've got this up for a potential reversal point, not a major line.

Lumber and Home Construction

Demographic Winter

The Sounding Line: Population Growth Matters
Confounding many predictions, decades of Zero Interest Rate Policy (ZIRP), proportionally much more QE than the US, much more debt, and a declining labor pool, have not led to runaway inflation in Japan. To the contrary, since November 1998, Japan has experienced 1.1% CPI inflation, not per year but over the entire period. Yes, real experienced inflation has almost certainly increased by more than this, but the broader point still holds.

There has proven to be no correlation between 20 years of ZIRP and CPI in Japan. Even right now, with CPI inflation running at 7% in the US, CPI inflation in highly trade dependent Japan is clocking in at just 0.6%. For reasons that we’ve discussed for years here at The Sounding Line, QE and ZIRP don’t cause increases in official inflation measures like CPI (though they do increase real world inflation).

This was one of the charts in the post:

This is the way the world ends

This is the way the world ends

This is the way the world ends

Not with a bang but a whimper.

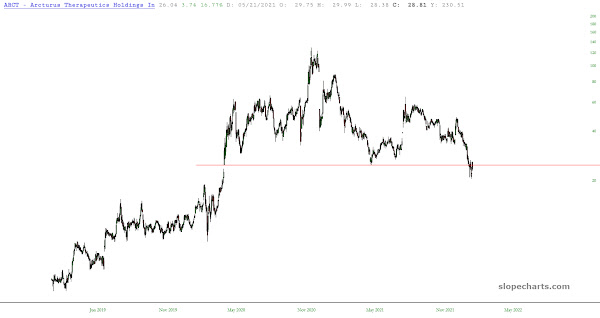
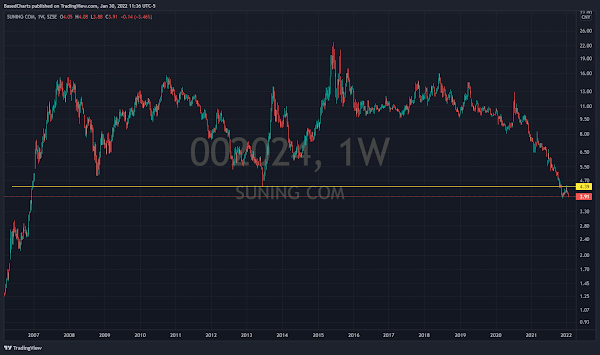
On macro analysis, I agree with all the above. The economy is structurally poised for deflation. Since 2008, the world has been trapped in a disinflationary environment. Japan's stock market peaked in the 1990s, parts of Europe in the 2000s, China in 2008. All of those peaks came within the proximity of the peak labor force. China's entry-level workforce began declining early in the prior decade. Now the U.S. workforce is in decline. The stock market has corrected off a trendline from 1929 and 2000 lending some support for the idea that a major bear market could have started. Could this go on for decades? It did in Japan for three decades already...

Financial markets tend to go out with bangs though, not whimpers. Politics is also different in each country. Policies such as pandemic lockdowns revealed the corruption and incompetence at all levels of government, including public schools, hospitals and the central bank. Will the public submit to the financial prison built for it, or will they revolt? 

Looking at a yen ready to crumble, one also has to entertain the possibility of disequilibrium shocks or "the end game." A decade ago, more than a few macro traders were looking to the yen as a top candidate for collapse because of its QE policies, high debt and demographic winter. My question is, will crude oil disturb the equilibrium and kick off this move? Assuming crude doesn't fall, in which case the pattern of the past 14 years can repeat again, can the global financial system absorb higher inflation? Or will inflation and rate increases set off a self-fulfilling collapse in the "demographic winter" currencies, with the oldest and more indebted sliding ahead of the younger and less indebted?

Today, markets are self-absorbed, focused handful of technology stocks propping up the Nasdaq and S&P 500. Focused entirely on what a bunch of egg-headed morons at the Federal Reserve say about interest rates. Two entire generations of investors haven't experienced a secular inflation cycle. The closest they came was the commodities bull market in the 2000s, but that wasn't enough to reverse the bull market in bonds. Not only are they ignorant, or cannot conceive events like a central bank hiking rates into inflation, but many market participants have negative intelligence. They believe things about inflation that are 180 degrees opposite to reality. Even after seeing the Nasdaq pummeled, they cannot imagine this trend could continue for an entire decade. 

The West has turned into a disinformation environment similar to the former Soviet Union. Everything is considered a plot. Constantly one hears "they won't let that happen" or "they can't let that happen," even from the opponents of central banking. There is a belief in centralized planning and centralized power similar to how the old Soviet economy or modern Chinese economy are analyzed. I don't take issue with conspiratorial thinking, only in the idea that the plotters are omnipotent. As if what they want is what they get.

Markets are controlled, but it seems that much of the market believes markets are the thing, instead of the harnessing of Nature, of the Invisible Hand. When markets are functional, they can still convey information in distorted situations such as monopoly pricing. When they are dysfunctional, they become agents of misdirection. It isn't the seen that will sink the market in the end, but the unseen. No government can overcome market forces in the end because they are forces of Nature, unless we included mass murder and lockdowns as "overcome" because governments can always make the situation worse. If we're scoring on success though, at some point reality intrudes. The bill for bad policy comes due in some form, via a channel that even the most adept government cannot control. 

There's no getting around demographic winter. Automation can offset the decline in labor, but it cannot offset missing consumer demand from consumers who were never born. Importing an underclass also doesn't work because it accelerates the currency endgame. Papering it over with debt "works" because demographic winter is disinflationary. Whatever inflation is produced funnels into financial assets, homes, cryptocurrency, art and NFTs. Commodity and consumer inflation is kryptonite for this world. 

Do you get the sense that the "people in charge" understand that rising crude oil, that rising inflation is an existential threat to them? Left to its own devices, the economy would remain trapped in disinflation/deflation, with the Fed doing round after round of QE for another decade. Yet there is talk of a reset, of implementing bone-headed policies that destroy energy, and food supply chains and transportation networks. Politicians and bureaucrats wrecked these supply chains over the past 2 years, do any of them seem panicked over how badly they screwed up? I don't see it. Barring an immediate political shift, risk of a politically-triggered collapse remains elevated so long as crude oil remains in an uptrend.

Credit Spreads Moving

The only "fakeout" on the stochastic indicator was in 2013, the taper tantrum when the Fed accounced its plan to start tapering later in the year. This time isn't a tantrum though, the Fed is following through quickly with the taper itself and rate hikes. I think credit spreads will widen, and that will be enough fuel by itself for the next leg down in equities.

新年快乐!

2022-01-30

Ready for the Yen Shock?

If USDJPY clears resistance, next stop is 125. In the process of getting there, it will clear the 40-year resistance line around 118. If it clears the last resistance just below 126, the mother of all inverse H&S patterns will complete with a target of 175.
The chart of USDJPY is much stronger once it breaks out though. Above the 170 area, there isn't much historical resistance to a move back towards the 265 level.

The Fed is Pumping Crude and Suppressing Bonds

For whatever reason, the Fed is still buying asserts at a $100 billion monthly clip. When they finally stop, crude should tumble or the 10-year yield will pop about 1 percent. All stock market rallies are technical until the Fed finally tapers and/or crude oil declines. If crude doesn't decline, then lights out for the stock market.

Natural Gas: Passport to Profits in a Bear Market

Rhyme time.

Small H&S Forming on XLP

Consumer staples have been relatively strong. If they roll over, it would complete a small H&S pattern with a target around $70 and below the support line in place since May 2020.

Fourth Sunday After Epiphany Part 2

The last screen was interesting, but I tightened up the market cap criteria and loosened the return criteria to find some larger companies. Here's what popped up in addition to CARR, DT and HOOD from the prior screen.

Fourth Sunday After Epiphany Charts

I did another volume screen. Note on these screens: I mainly adjust criteria to create a manageable list. Today's list is only 30 stocks. Below are the best looking ones, along with familiar names or interesting charts for one reason or another. Main criteria: market cap above $300 million, average volume above 100k and up 1.5 times on Friday. Price change -10 percent to +5 percent last week, but -10 percent to -5 percent in the past month. Basically, I'm trying to get at some stocks that may be completing tops. Maybe some bounce plays? Let's see, as I've typed this before going through the list. Charts after the jump.

As I'm going through this list, the biggest theme is recent IPOs. I left off a bunch of plunging IPOs because its the same chart and their market caps are in the $1 billion range. Speaking of which:

Suning Tesco Net Loss Exceeds Its Market Cap

iFeng: 市值360亿巨亏超400亿!昔日巨头这是咋了?交易所火速发函

Uusally when I see news like this, the chart will be a bad short candidate, either because losses have already piled up or it is actually nearing a bottom and this was the final bad news. in this case, 002024 looks like a great short. The key will be taking out the low. Were it to reverse above the horizontal it would become a bounce play.

Market Becames More Reliant on Apple

The stock market has spent the past three months becoming ever more reliant on Apple. As a result of Apple's relative strength, it is now 24.15 percent of SPDR Technology (XLK) and 11.64 percent of the QQQ. Microsoft is 21.91 percent of XLK and 10.09 percent of QQQ. The next largest holding in each fund is Nvidia 3.76 percent and Amazon 6.76 percent.
If Apple plunged to $110 this summer, it would't violate the uptrend in place since 2002. Microsoft could be cut in half and it wouldn't violate an uptrend in place since its IPO in 1986.

King of the Semiconductors

TSM is 11 percent of SMH.

Chart Wars: IWM

The Russell 2000 Index is arguably the cleanest of all the charts. There is a huge topping pattern with overhead supply. It is about 9 percent away from Friday's close, plenty of room for face-ripping rallies. On the other side, there is barely any support between the low of last week and the November 2020 level. A symmetrical repeat of the move up would see a small bounce, maybe followthrough buying on Monday morning, followed by a relentless drop of about 15 percent, to around $165 per share.
The volume profile lines up almost perfectly with the chart. The 10-year shows barely any support, while the 2-year shows there is an airgap below $190. My horizontal line is at $191.26 on the chart above, but I've since adjusted to Friday's low because that is the new psychological line-in-the-sand.

2022-01-29

Chart Wars: QQQ

I covered the S&P 500 Index earlier. That post has more commentary. This one is simpler. Coming into last week, I expected a possible 6 to 7 percent rally back up to resistance. I made quite a bit on Monday, my largest one-day gain ever in terms of dollars, by catching most of the reversal from low to high. While the S&P 500 chart is a bit messy, the Nasdaq and QQQ are clean. There's a clear window for a 7-percent rally to resistance or a 5-percent drop through the lows of last week. Similar to the S&P 500 Index, a rally up to resistance would create a large head-and-shoulders pattern. If down is the direction, the expected move from Friday's close is a 20-percent decline. The 5 percent down to the low, and then approximately another 16 percent. If the Nasdaq rallied up to resistance, it would be another 20 percent down. In conclusion, the total decline from the high should be in the 25 percent to 30 percent area, around $300 on QQQ, and the only debate for me is how much the bulls can push it up before then.

The Questions Keep Piling Up on mRNA Shots

Market Ticker: So..... Covid-Like Illness 76% Of The Time Is PCR Negative?
The Morbidity and Mortality Weekly Report (MMWR) claims "get vaccinated and/or boosted."

Oh really? That's the conclusion?

What about the 76% of the people with Covid-like illness that tested negative for Covid-19?

How does taking a jab (or more than one jab) help those people when the jabbed are the majority of the encounters?

Yet, by the allegedly solid tests those people do not have Covid.

So why are they in the ER or UC with Covid symptoms, and how is it that they're declared to have Covid?

WTI in Euros

Doing the chart in Brent produces the same result. The Eurozone is already paying near 2014 highs for oil, around $100 if we were talking about the U.S. If the dollar continues rising with crude oil, European markets are going down.

Chart Wars: S&P 500

The S&P 500 Index failed right at the taper line and before reaching the 1929-2000 top trendline. There are three almost parallel lines formed after the 2009 low, the top taper line, the support line and the midpoint. The S&P 500 is coming up on the midpoint line. Prior QE-related selloffs in 2010 and 2011 were larger percentage-wise or went to the midpoint line. The selloff in 2015-2016 took much longer and was shallower as a result. The 2018 correction started lower and went lower. 

The strongest case I can make for at least reaching the midpoint area is that stocks are coming from. They reached the taper line and the 1929-2000 line. Fueled by rampant speculation and central bank support, stocks went almost to what the chart says is their most extreme high possible.

Long story short, there are two clear possibilities now. A rally up to a higher resistance area such as 4500, or a breakdown to the sub-4100 area. On the side of a rally is the breaking of short-term resistance levels. There's also the "oversold" indicators and growing bearish sentiment, but sentiment indicators become near worthless in these conditions because the bottom is unknowable. Markets crash in these conditions. On the bearish side, there's a bear flag formed. The slight violation into Friday's close might be a bull trap. 

That Apple was a massive portion of that move and still barely off its all-time high, also tilts bearish in my opinion. Apple would likely go to a new all-time high if the market were to rally hard and I don't see that happening. It's more that the market is now setup nicely for an "inverse" of the past three months, something I expected a couple of weeks ago, but may finally come to pass: the fall of the tech giants. ARKK could plunge into the abyss on a broad bear move, but I think it'll be stocks like Apple, Google, Tesla and Amazon behaving more like Netflix, that will form the final phase of this bear mauling.
It is said that the markets like to make everyone lose, so what is the outcome that would cause the most pain? Probably something like this: a move abouve 4500 that would hammer the bears looking for a breakdown now, while sucking in all the bulls who will have FOMO wishing they bought earlier. They would be screaming about new all time highs and if 4500 is violated, many bears would worry they are right. It's worth noting that if the S&P 500 failed at 4500 and rolled over, the target for this pattern is the same. It would have a smaller right shoulder.
Looking more granular, the weekly candle is bullish. The one exception was in 2015. The first hammer candle was a fakeout:
Now:
To conclude: a bullish rebound wouldn't be the end of a bear market. Far from it. The Federal Reserve is still doing QE at full-blast, yet stocks have performed this way. The entire taper thesis of falling oil and sliding equities has not yet started. The entire move to this point is a psychological one, a pricing in of a coming taper and rate hikes.

All of the other rallies had one of two things in common. One, the taper was finished. The May 2010 flash crash, summer 2011 swoon, 2014-2016 slide in commodities and then stocks, the 2018 QT correction, the March 2020 panic, none of those occurred with Fed support ongoing. Two, the most recent reversals came because of a Federal Reserve policy reversal. The 2016 decline ended with the Shanghai Accord, the 2018 slide stopped when QT ended, but the markets were weak. The Fed did a "stealth" QE with reverse repos in September 2019 and even that wasn't enough. I don't need to rehash 2020-2022. 

The bulls might produce a Pavolivian echo rally. They may buy the dip as if they had Fed support. It will fail assuming the Fed ends QE, because the Fed is going cold turkey. This correction occurred with the Fed providing 80-percent of peak QE. If the Fed is stupid (all evidence says yes), they might keep QE high into March, praying markets stabilize. Or they're going to have to stop the lying and actually taper down to $30 billion in purchases next month, which will be a 70-percent drop from their January buying. 

The wildcard in all of this is crude oil, which remains near 7-year highs. I believe their QE efforts are backfiring by lifting crude oil instead of stocks, setting markets up for a much bigger fall than necessary. Whatever bulls claw back in the days and weeks ahead will be added fuel for the next bear mauling.