


FTAV’s Friday charts quiz
-
To those about to chart, we salute you

![[Most Recent Quotes from www.kitco.com]](https://lh3.googleusercontent.com/blogger_img_proxy/AEn0k_uR4fzdje74Wf9NFSGpIwMsercdloA5yqtdN0KU2uumpL5zMf-8MLNq27WAMP83r5EH04RD9UsjuBYQSj-n83KC374IHZvbvCGHu2rohRXHqqouYntk-JEPr3Q=s0-d)
|


I posted some trades over on the Substack.
The 3-month Treasury bill rate is a proxy for the Fed funds rate. From the chart below, you can see the Fed funds rate used to fluctuate around the 3-month treasury rate. In the 2000 and 2008 recessions, and again in 2020, the market dropped interest rates faster than the Federal Reserve.

Something different is happening now. The market is raising interest rates faster than the Federal Reserve. If you notice the green line, the market takes rates up in between meetings and the Fed then catches-up by closing the gap to near zero. Notice the gaps widening? Remember Powell saying 75 bps was off the table? Then it wasn’t. The Federal Reserve is following the market and not vice versa. If the market believed the Federal Reserve and was following it, then the gap between the market rates and Fed funds rate would adhere to Fed policy and jawboning, and not the other way around.
The spread between the market and the Federal Reserve is still widening. The 3-month treasury yield is almost 125 basis points ahead of the Fed funds rate heading into this meeting 114 bps according to FRED). This is a wider gap than existed in June when they switched to 75 basis point rate hikes.

The current gap might not enough for a 100 bps rate hike because it would leave less than a quarter point gap. However, a 75 bps hike will leave the gap at around 39 bps. Notice that will be lower than the gap than at all previous rate hikes. The Fed should hike 100 bps if this chart factors into their decision making. The chart is saying the Fed is not only losing its battle, but that it is in a worse position today than it was at the start of its rate hiking.
With the market currently 50/50 on a 50 bps vs 75 bps hike in December, the Fed can push those odds with a hawkish statement, but they’ll still be behind again in December unless the market slows its pace.
In conclusion, the Federal Reserve is chasing the market higher and, key point, the market is accelerating its rate hikes. The Fed’s 75 bps pace falling behind the market’s pace. The speculators on Fed policy are undecided between 50 bps and 75 bps for December. If the bond market doesn’t slow down or worse, continues accelerating, 100 bps hikes might be on the table.


With the caveat, if bonds continue lower, a breakdown in ZB and breakout in 30-year yield correlates with about 5 percent interest. That isn't a crazy target when considering the Federal Reserve is talking about a 4-percent Fed Funds rate. I do expect deflation and a rally in long bonds, but if I'm wrong, it isn't a wild target. It would take ZB and TLT back to 2007 levels of around 110 and $90 per share. Note that TLT is dividend adjusted, remove that and you will see TLT at $90 when the yield was around 5 percent.I'll also not that the new buzzword from Fed watchers is a 5 percent Fed funds rate.


Finally, long-term government bonds continue their slide.


Microsoft and Google both traded at new 52-week lows the past couple of days. Didn't close at new lows.


Here's the yoy change in the Fed's balance sheet versus BTC.


Yesterday was a macro disaster for stocks. It was a bullish day, but damage in commodities and bonds signal this rally is running out of fuel. Going to run through a lot of charts today, all after the jump.
For myself, I am always early. I closed out the biotech trade when it got into that consolidation range. I had July puts so it wasn't a bad trade, but then I also closed SMH calls and they've run as well. I've done fine with other positions such as short oil, long treasuries, and long yen, but I say to this to be clear: my WAG targets for the rally initially were 25 percent for Nasdaq and around 2000 on the Russell 2000 as my charts show. They might get there and that is a risk for bears.
That said, I'm buying puts here for September and October. I have a big "crash" trade on FCX and I'm looking for more trades like that. If Apple fills its gap, I'm really not kidding when I say that's a retirement line. I'm going all in at that point as long as nothing has changed to shake my outlook.
On to the charts.




AP: EXPLAINER: How do we know when a recession has begun?
By one common definition, the U.S. economy is on the cusp of a recession. Yet that definition isn’t the one that counts.The U.S. isn't on the cusp of recession. By the common definition of negative growth in two consecutive quarters, a recession is already six months-old if BEA reports a negative number on Thursday.
As for definitions, they can be flexible. I don't think a bear market is a 20 percent drop in stocks. Every correction from 2009 to 2021 was a correction, not a bear market, even though stocks fell 20 percent or more at times. What's the quibble with the recession definition?
But economists say that wouldn’t mean that a recession had started. During those same six months when the economy might have contracted, businesses and other employers added a prodigious 2.7 million jobs — more than were gained in most entire years before the pandemic. Wages are also rising at a healthy pace, with many employers still struggling to attract and retain enough workers.(long string of expletives)
Excuse me FRED, can you drop some tactical nukes for me?
FRED: Sure thing boss!
Great, let's start with rising wages. Adjust those for inflation would ya Freddie?
FRED: Incoming!

The job market’s strength is a key reason why the Federal Reserve is expected to announce another hefty hike in its short-term interest rate on Wednesday, one day before the GDP report. Several Fed officials have cited the healthy job growth as evidence that the economy should be able to withstand higher rates and avoid a downturn. Many economists, though, are dubious of that assertion.Shall we drop another tactical nuke on their critical meme infrastructure?

The Fed is also trying to combat raging inflation, which reached a 9.1% annual rate in June, the worst mark in nearly 41 years. Rapid price increases, particularly for such essentials as food, gas and rent, have eroded Americans’ incomes and led to much gloomier views of the economy among consumers.Inflation creates a price illusion. Only looking at wages, revenues or GDP makes one think there's growth. The number is going up. Adjusting for inflation reveals the more activity you engage in, the more money you lose because it's happening with devalued currency. .
It did in the first three months of the year, when GDP contracted 1.6% at an annual rate. Economists have forecast that on Thursday, the government will estimate that the economy managed to grow at an annual rate of just below 1% in the April-June quarter, according to data provider FactSet. If accurate, that forecast would indicate that the economy isn’t technically in recession by any definition.This isn't an argument devoid of logic. There have been near-miss recessions in the past. The flaw here is inflation. It assumes these numbers are accurate and won't be revised in the future. Given the high rate of inflation, I'm highly confident future revisions will be negative.Even if growth does go negative for a second straight quarter, Fed officials and Biden administration economists point to a lesser-known measure called “gross domestic income.”
GDP calculates the value of the nation’s output of goods and services by adding up spending by consumers, businesses and governments. By contrast, GDI, as the name implies, seeks to measure the same thing by assessing incomes.
Over time, the two measures should track each other. But they often diverge in the short run. In the first quarter, GDI grew 1.8% — much better than the 1.6% decline in GDP.
As part of its judgment of whether an economy is in recession, the NBER considers an average of the two measures. In the first quarter, the average was 0.2%, suggesting that the economy expanded slightly.
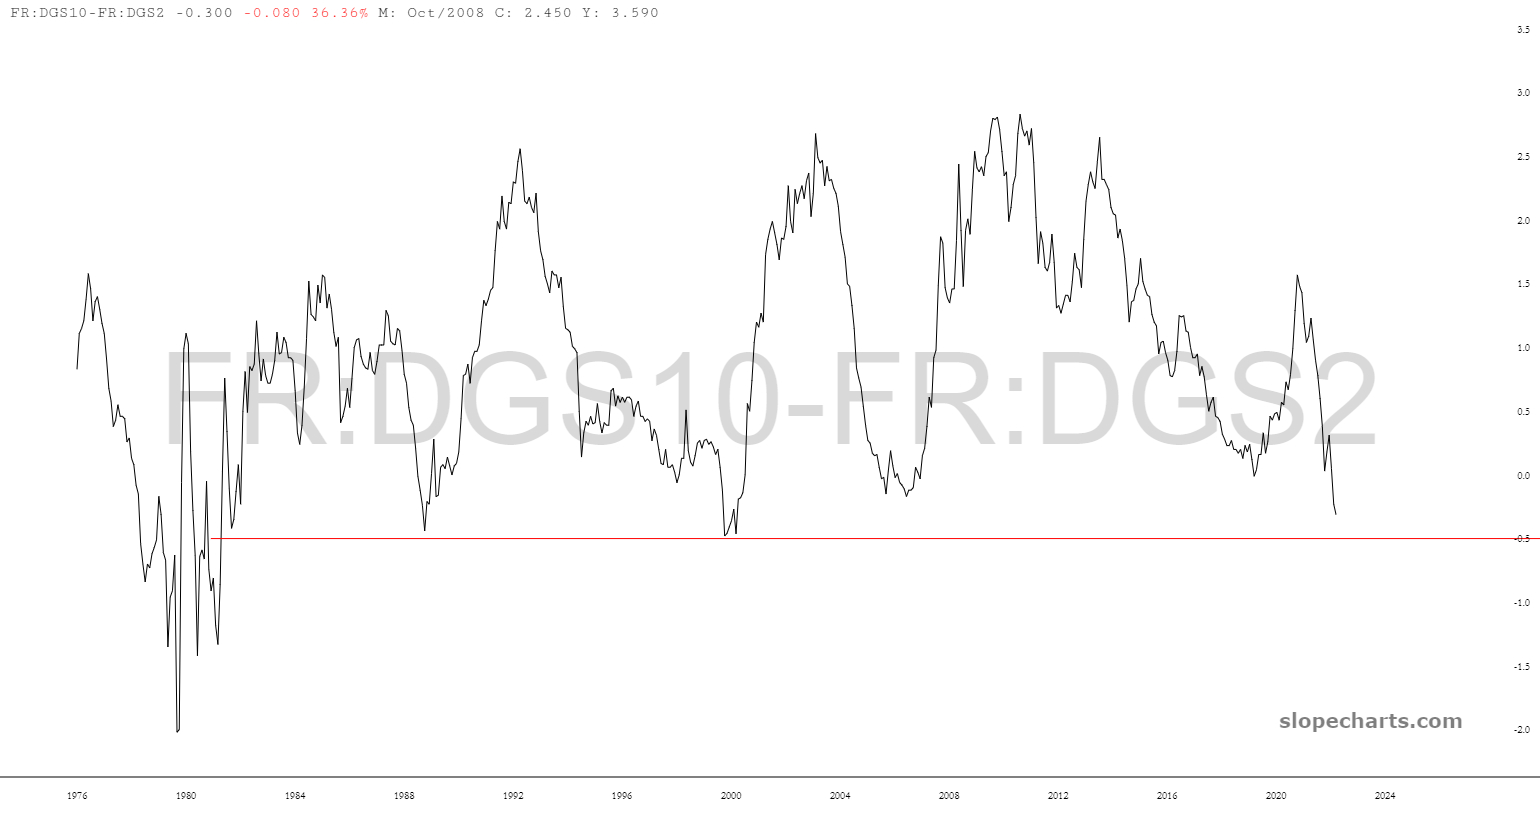
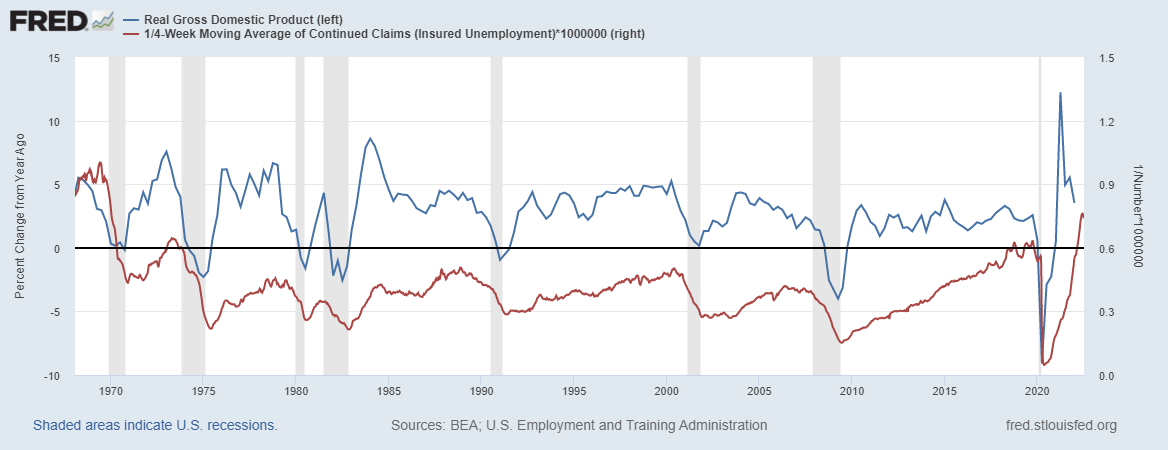
Consider these charts and comments from Jeff Snider:

Inverted curves aren't about what just happened. They've already discounted the (likely) 2 qtrs of negative GDP. IOW, the "technical recession" is already in there.
— Jeffrey P. Snider (@JeffSnider_AIP) July 26, 2022
The deep inversion is about what's still coming. And if what already did is half a year of lower output... pic.twitter.com/QGl8KNiezI
The market can't be discounting something like dot-com recession, because that scenario would mean we've already had the recession (Q1/Q2 '22). Can't be something like H1 '08, either. Inversion *has* to be something like 81-82 or 2d part of 08-09.https://t.co/EH7guxTKpo pic.twitter.com/iwE3bxruVq
— Jeffrey P. Snider (@JeffSnider_AIP) July 26, 2022


